Contents
TABLE OF CONTENTS
- OVERVIEW
- Key Findings and Takeaways
- About CCN
- About the Report
- Introduction
- INNOVATOR AND DEAL LANDSCAPE
- Data at a Glance
- Index Overview
- Technology Dimensions
- Commercial Dimensions
- Capital and Deal Dimensions
- CAPITAL LANDSCAPE
- Data at a Glance
- Index Overview
- Investment Analysis
- Focus Areas
- Capital Deployed
- CORPORATE LANDSCAPE
- Data at a Glance
- Index Overview
- Intersection Points
- CATALYST LANDSCAPE
- Data at a Glance
- Index Overview
- Activities and Focus Area
- ACKNOWLEDGEMENTS
2021 Research Results
Compiled by the Circular Carbon Network
Download PDF
TABLE OF CONTENTS
- OVERVIEW
- Key Findings and Takeaways
- About CCN
- About the Report
- Introduction
- INNOVATOR AND DEAL LANDSCAPE
- Data at a Glance
- Index Overview
- Technology Dimensions
- Commercial Dimensions
- Capital and Deal Dimensions
- CAPITAL LANDSCAPE
- Data at a Glance
- Index Overview
- Investment Analysis
- Focus Areas
- Capital Deployed
- CORPORATE LANDSCAPE
- Data at a Glance
- Index Overview
- Intersection Points
- CATALYST LANDSCAPE
- Data at a Glance
- Index Overview
- Activities and Focus Area
- ACKNOWLEDGEMENTS
OVERVIEW
Summary of Key Findings
The Circular Carbon Network gathers detailed information about the leading players in the emerging Circular Carbon Economy in a series of living online data Indexes. We believe this is the most comprehensive collection of market data about this critically important emerging sector available anywhere. The purpose of the Circular Carbon Market Report is to share an analysis of our data in a way that gives more context, character, and depth to this ecosystem, increases overall societal interest and understanding, and facilitates informed action. We hope you find it useful.
Here are some of the highlights of our analysis:
1. INNOVATOR & DEAL LANDSCAPE
The Innovator Index and Deal Hub
The Innovator Index and its companion database, our Deal Hub, tracks key technology, product, commercial, and capital data about the solution provider landscape for potential investors, commercial partners, and other key stakeholders.
Key Findings
The Circular Carbon innovator landscape is diversifying and growing rapidly. There is a broad spectrum of companies from around the world developing and commercializing a varied range of innovative Circular Carbon solutions for applications in different end markets. Moreover, even though the sector is still relatively young, there are meaningful numbers of companies at all stages of technology maturity, commercial deployment, and revenue generation, from new startups doing their first pilots to successful growth stage businesses. The same is true for the increasing depth and breadth of the investment opportunities we are seeing on the Deal Hub, where we find a diversity of deals across investment stages, type and size of investments sought, valuations, target investors, and other key factors.
- Significant Increase in Capital Raised: We were able to identify investment-to-date totals for 185 out of 403 companies in the Index of approximately $3 billion. Since our 2020 report, this is an increase totaling $884 million.
- Meaningful Increase in Total Investment Opportunities: There was a 14% increase in capital sought (by slightly fewer companies) compared to 2020 numbers. Our Deal Hub tracked 105 companies (roughly a quarter of the entire Innovator Index) seeking over $816MM in capital in 2021.
- Valuations Increasing: The total pre-money valuation for all the companies in the Deal Hub (62/110 companies) comes to over $6.9B. This is a significant increase from 2020 — by $5.4B — and this number is likely understated. This strongly suggests that increased general interest in the sector (by entrepreneurs, investors, policymakers, and corporates) is now leading to rising valuations, something to watch carefully in the coming year(s).
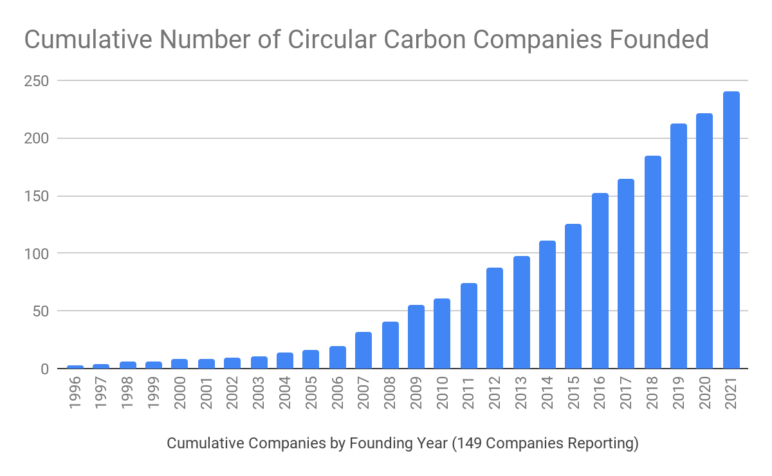
- Company Formation Picking Up Pace: Of the companies we have founding year data for, 52% report they were established in 2015 or later, and 9% of all companies with founding year data were started in 2021 alone.
- Wide Distribution of Technology Readiness, Including Growing Cohort of Mature Companies: While 42% of the reporting companies in our Index classified themselves as early-stage TRL’s of 1-5, even more (58%) classify themselves as somewhat technologically advanced at a TRL of 6 or above. Nearly half of those report as highly advanced (TRL 8 & 9).
- Growing Revenue Traction: Of the companies that we have revenue information on, over half are already generating revenue. Half of these are generating over $1MM. At the same time, 44% are still pre-revenue. Total revenue reported by companies in the Index ranged from $562MM to $1.425B.
Data Snapshot
403
Companies
38
Countries
$3.1 Billion
Capital Raised
221
Deals Tracked
$817 Million
Investment Opportunity
2. CAPITAL LANDSCAPE
Key Findings
The emerging Circular Carbon investor landscape is already quite diverse and includes a broad range of institutions, types, and size of investments. Overall, the firms in the Index are managing a significant amount of capital and express a high level of interest in a wide spectrum of Circular Carbon opportunities. All of these different factors can be filtered and viewed in the Capital Index here.
- Increase in Corporate Equity Focused on the Sector: Corporate Equity is the largest investment type reported in the index, having increased by 46% from 2020. This is perhaps reflecting the growing rush of equity capital into earlier-stage Circular Carbon solutions that are coming to market.
- Increase in Target Check Sizes: The majority of investors in the Index reported being able to deploy an initial investment of $1MM or more into a single company, while 29% are looking to invest $10MM or more.
- Notable Increase in Patient Capital: The majority of investors indicate a typical horizon of between 3-7 years. However, we are also tracking a 150% increase in patient capital (7+ year horizon) from 2020, a good indicator that more investors are comfortable with the longer technology and market development times that are likely required for the maturation of the emerging Circular Carbon economy.
- Increase in Impact Focus, Decrease in Returns-Only Focus: The expressed preference of the investors in our Index report that impact and returns are equal factors in their investment decision making (28%). An increasing number stated they are willing to accept lower returns or higher risk for impact, representing 15% of the firms in our Index. These results suggest that the shift towards integrating impact into investment decisions is here to stay.
- Significant Increase in Tracked Capital Deployed: Our research has identified 80 investments totaling $244MM into Circular Carbon-specific opportunities (both Carbontech and Carbon Removal) by investors within the Capital Index. This is an 87% increase in the value of investments recorded in the Index versus 2020 ($131MM in 2020).
Data Snapshot
159
Firms
14
Countries
$202 Billion
Assets Under Management
3. CORPORATE LANDSCAPE
Key Findings
While corporate intersection points are still clustered at the “front end” of technology development (R&D and investment in technology developers), corporations are also engaging by supplying critical components to the market, commercializing their own solutions, hosting commercial demonstration projects, and collaborating across institutional boundaries. These activities, however, are still just emerging and there is evidence that there is a general lack of strategic clarity about their role in, and the impact on their businesses of, the Circular Carbon Economy. Given the slow pace of change in large organizations, this may be understandable; but it may not be enough.
CCN’s Corporate Index covers 80 large global corporations from 21 countries and 19 industry verticals (from oil and gas, power, and chemicals companies to technology and consumer products companies). While about two thirds of the worlds largest emitters have a net-zero pledge, the corporates in this Index represent approximately 17% of both global CO2 emissions and Fortune 500 corporate revenues , and employ over 7 million people.
- Corporate Activity Expanding from R&D to Purchasing and Investment Companies added to the Index in 2021 are more focused on purchasing and investment than last years data shows. Two-thirds of these additions are active in purchasing Circular Carbon solutions, in sharp contrast to 2020, when purchasing was the lowest reported focus area. Similarly, nearly two-thirds of these new additions are focused on investing in third-party solutions, while less than half are involved in R&D.
- Growing Corporate Investment Interest in Carbon Removal Corporate interest in investing in Carbon Removal solutions is pacing that of Carbontech, with each increasing between 42% and 44% year-over-year amongst those corporates in our Index with a cleantech-focused investment arm. In fact, overall, 78% (18) of the 23 corporate cleantech investors now have carbon removal as a core focus or secondary focus.
- DAC-to-Sequestration Top Corporate Carbon Removal Investment Focus, Natural Carbon Removal Solutions Rising Too This year, DAC-to-Geologic Sequestration appears to be the top focus for corporate investors interested in Carbon Removal, with 79% (15/19) of those disclosing their target Carbon Removal interest areas highlighting that pathway. DAC-to-Durable-Products is another similar highly represented focus area for corporates in the Index. We also found a significant growth in interest in Natural Carbon Removal solutions, with Soil Carbon Sequestration and Afforestation/Reforestation each doubling this year as focus areas. Finally, Ocean-Based Carbon Removal and Enhanced Weathering were each new to this year’s report and have gained the interest of 3 and 2 corporates in the Index respectively.
Data Snapshot
80
Number of corporates
19
Industry Verticals
21
Countries
6.3 Billion
CO2 Emissions (Metric Tons, Scopes 1, 2, 3)
$5.43 Trillion
Revenues
7.45 Million
Employees
4. CATALYST LANDSCAPE
The Catalyst Index
The Catalyst Index is designed to help market participants of all types better understand and access the services, expertise, resources, and support that the growing number of enabling organizations in and around the Circular Carbon sector offer.
Key Findings
The emerging Circular Carbon Catalyst ecosystem includes a diverse spectrum of over 23 types of organizations, with the most common being NGO’s, convenors (like CCN), and commercial service providers (like attorneys, consultants, and engineering firms). These organizations are generally modest in size with less than 100 employees, but are also highly focused on the Circular Carbon sector, with a majority focused on Carbontech-related issues specifically. The target core customers and stakeholders of these organizations are primarily entrepreneurs and corporates, but also include capital providers, governments, and the public. All of these different parameters can be filtered and viewed in the Catalyst Index here.
- Growing Diversity in Catalyst Org Types Conveners and Platforms are the most common organization type this year, versus last year’s leader NGOs. Service providers are the second highest, perhaps evidence of the growing business opportunity in servicing the Circular Carbon economy. There is also growth in Accelerators and Think Tanks.
- Significant Increase in Policy Focus and Overall Diversity of Activities We saw a significant increase in organizations focused on Policy (a 144% increase from last year) with 23 more policy-focused organizations added in 2021. This is both a reflection and possibly a driver of increased global policy activity around Circular Carbon and climate change more generally.
- Diverse Target Customers, Large & Small, with Government Noticeably Rising on the List In order to understand who the organizations in the Catalyst Index seek to pair themselves with, we identified each of their core target stakeholders. The two top customer groups are on opposite ends of the size spectrum – corporates and start-ups. The other large groups are capital providers, governments and the general public. As the numbers suggest, many seek to serve multiple of these groups. Government as a target stakeholder grew noticeably this year, which might reflect the uptick in Circular Carbon-relevant policy activity globally.
Data Snapshot
101
Organizations
9
Countries
23
Service Types
About Us
Catalyzing Capital for the Circular Carbon Economy
Mission
The Circular Carbon Network is a non-profit initiative catalyzing investment and commercial activity in this important emerging sector to help accelerate its growth and realize its full, economic, and climate potential.
Focus
We do this by educating the market through our research and publications, convening market leaders around critical topics of interest, and catalyzing active collaborations between innovators, investors, corporates, and other key stakeholders in the sector.
Team
The Circular Carbon Network (CCN) was founded by XPRIZE and Pure Energy Partners in 2017 following the 2015 NRG COSIA Carbon XPRIZE, and more recently supporting the launch of the 2021 XPRIZE Carbon Removal. Our matrixed team includes experienced clean economy investors and entrepreneurs, scientists, data specialists, communication professionals, and market researchers.
About the Report
In-Depth Analysis of Circular Carbon's Growing Momentum
This is our second annual Market Report, a comprehensive and detailed analysis of the key players in the Circular Carbon Economy. Our first-of-its-kind 2020 Market Report laid the foundation for this Report. This year we have focused on expanding the breadth and depth of our Indexes.
Built on Unique Databases
CCN has continued to aggregate data on the participants in the growing Circular Carbon ecosystem in our catalog of Indexes. These include:
- The Innovator Index (featuring over 400 leading solution developers),
- The Deal Hub (detailing nearly half a billion dollars of live investment opportunities for accredited investors),
- The Capital Index (which profiles over 160 active climate, carbontech, and carbon removal investors),
- The Corporate Index (focused on the growing list of global companies active in the sector),
- The Catalyst Index (tracking the organizations who are the leading enablers of the Circular Carbon Economy, such as service providers, technical experts, and policy advocates).
Broadening Beyond Our Base
It is important to note that our databases were originally built based on data from the NRG COSIA Carbon XPRIZE, which focused more directly on carbon capture and utilization (also known as “carbontech”). While we have since expanded our focus to include the broader world of carbon removal (including technological, oceanic, geological, and biological solutions), the foundation of our data is rooted in the carbontech sector, and this does still influence our overall numbers. We are now actively looking through a broader Circular Carbon lens, and adding data to all our Indexes about the rapidly growing and diversifying carbon removal space, including the emerging innovators competing in the XPRIZE Carbon Removal.
Focused on Informing and Inspiring Action
The goal of this report is to share an accessible and digestible version of what we have learned about the state and direction of the Circular Carbon economy through working with our Indexes. By identifying current opportunities and challenges for the continued growth of this space, we ultimately aim to catalyze more informed activity in the circular carbon economy at an accelerated pace.
Methodology
The data compiled in this Report comes from a broad combination of sources, including internal quantitative research, self-reported data by market participants in response to our surveys, and the generous cross-sharing of market data by our global partners. We believe it provides a uniquely detailed resource to the marketplace. We also recognize its limitations. We know there are many gaps in our data and in our coverage. The responsibility for any inaccuracies rests with us alone. As the Circular Carbon Network is not a commercial data research service, but a market catalytic, non-profit initiative, we rely on collaboration and data sharing to improve the depth and richness of our Indexes. If you are actively engaged in the Circular Carbon Economy, we invite you to add or update data about your organization here.
INTRODUCTION
2021: A Watershed Year for Circular Carbon
The Carbon Removal Imperative
It is common knowledge to anyone working in or around the Circular Carbon field that in order to limit the most severe effects of climate change, we need to reach net-zero emissions by 2050, and net-negative shortly thereafter. To do this, we need to remove upwards of 1,000 billion tonnes of carbon dioxide from the atmosphere by 2100 (IPCC), and possibly 2 to 4 times that amount. With current global annual emissions at around 51 billion mtCO2e, the math tells us that even if we start deploying Circular Carbon solutions at scale today, we will still need to see an annual growth rate in reductions and removal capacity of over 55% to avoid a 1.5 degree Celsius global temperature rise. Delaying deployment at scale, even by a few months, has measurable and exponential effects.
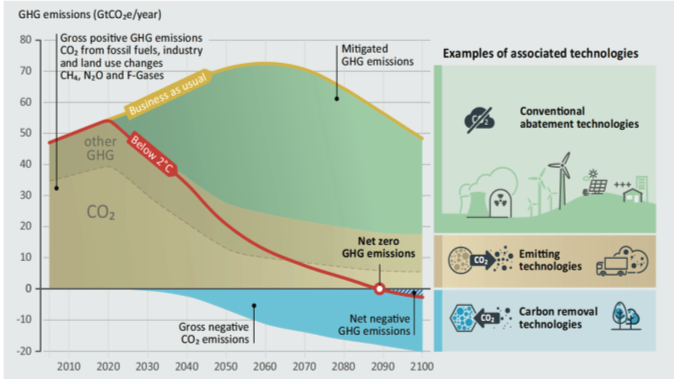
Carbon Mitigation and Removal Both Needed at a Massive Scale
The Pathways
The good news is that we already know how to get there. There is a broad portfolio of solutions for both removal and mitigation – and these solutions will thrive when scaled concurrently and together, not in separate silos. As we know, there is no one silver gigaton bullet.
Together, the players in this emerging sector represent possibly the most unique cross section of industries and professionals ever working together in history. From big agriculture to big oil, industrial engineers to geologists, ocean kelp to chemical solutes, those working in the Circular Carbon sector are united by the common goal of reversing a century of atmospheric imbalance (and for many, rebuilding successful, sustainable industries in the process).
As you will find in our 2021 Market Report, all the major Circular Carbon solutions one can imagine are starting to come into play, across technological, biological, and geological pathways. For clarity as we lay out our findings across these emerging pathways in this report, some definitions are in order.
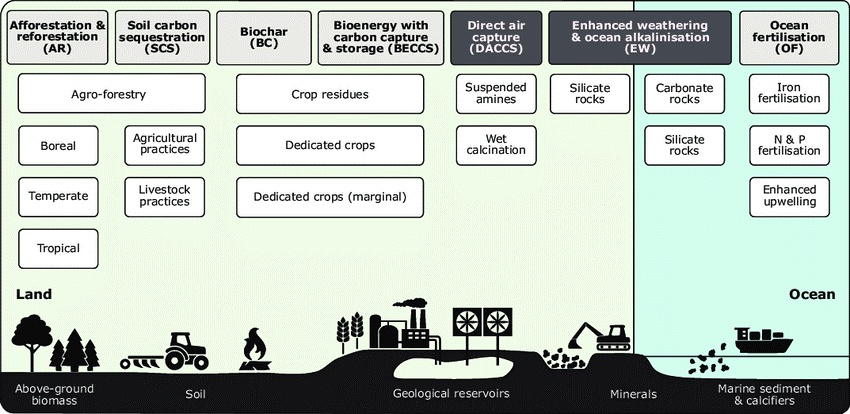
Source: Minx et.al. 2018
Circular Carbon Defined
Circular Carbon Defined
We know that terminology in the rapidly evolving climate solution space can be confusing, which limits understanding, engagement, and action. We use the term “Circular Carbon” in our name and in this report to refer to the overall emerging ecosystem of solutions that: (1) directly cycle carbon-based molecules; and (2) help address climate change in a material way.
Another way of thinking about Circular Carbon is as a useful overarching term encompassing two related, sometimes overlapping, but generally distinct sub-sectors in the carbon solution space: “Carbontech” and “Carbon Removal”.
In turn, we define “Carbontech” in this report as:
Technology-enabled means of capturing, utilizing, and/or storing carbon-based GHG molecules (principally CO2), whether derived from the atmosphere or ongoing emissions
And “Carbon Removal” as:
The durable removal of CO2 from the atmosphere, whether by technological, biological, geological, or other means
Circular Carbon = Carbontech + Carbon Dioxide Removal
Thus, inspired by the global carbon cycle itself, Circular Carbon solutions help cycle carbon-based molecules in a way that creates a material climate benefit.
There are several cases of overlap between carbontech and CDR, examples of which include Direct Air Capture, certain types of sequestration, and durable carbon utilization. We believe the term Circular Carbon is a broad representation of the industries that derive value from carbon by providing a material climate benefit.
Total Available Market
Multiple interdisciplinary studies have described the massive economic opportunity that a Circular Carbon economy will create. Here are a few examples of the latest research on the space:
- Carbon-to-Value Markets: Our partners at Carbon180 estimate the total available market (TAM) for carbon-to-value products (such as fuels, building materials, and plastics) at $1.07 trillion per year for the US alone and $5.9 trillion globally.
- Carbon Offset Markets: The offset market has seen unprecedented growth in 2021, reaching over $1billion in offset transactions sold for the first time according to Ecosystem Marketplaces. According to BNEF, the demand for offsets could increase fifty-fold by 2050.
- Carbon Capture and Storage (CCS) has an estimated Total Addressable Market of US$2 Trillion by 2040, according to research done by ExxonMobil. The CCS market is greater than estimates for hydrogen and biofuels combined (a TAM of ~US$1.4tn).
- Columbia Circular Carbon Economy Report references the total infrastructure capital cost of CO2 recycling at globalscale, summed across all pathways (excluding methane production and duplicate products) is $27.5 trillion.
- IEA reports on skyrocketing activity in 2021 for CCUS, with plant plans and investment boosted by the more than USD 25 billion committed funds from governments and industry. In addition, USD 12 billion of support for CCUS investment in the United States was included in the Infrastructure Investment and Jobs Act signed by President Biden in November 2021.
- McKinsey reports on negative emissions solutions being particularly underinvested, with capital flows currently at just $10 billion per year… while annual investment of approximately $300 billion [will be required] for those solutions to scale to meet the climate challenge – a 30-fold increase from today.
Momentum is Building, Quickly
The scale and frequency of climate change impacts continue to affect the global community in increasingly threatening ways. From food insecurity to wildfires, extreme weather to the devastating impacts of new diseases, we face compounding and continuous challenges that threaten our livelihoods.
Increasing disruption of the world’s natural systems will continue if we fail to take urgent action. While this report makes it clear that interest and activity in the Circular Carbon sector grew rapidly in 2021, there remains a Grand Canyon sized gap in between where we are and where we need to be.
But still, the progress over the last 12-18 months has been significant. In wake of the economic shock of the pandemic, the Circular Carbon economy has demonstrated remarkable resilience. There has been record investment of both institutional and non-institutional capital, an onslaught of net zero commitments from the corporate sector, and record breaking governmental investment and commitments to climate action.
And many other signs of progress too … We see increasing coverage in the broader media coverage of climate action. The announcement of the $100MM Carbon XPRIZE in February of 2021 catalyzed a global wave of activity from innovators around the world as they thought about creative, new moonshot solutions. And the market is starting to bring these Circular Carbon ideas and companies to scale, as evidenced by the announcement of the first several unicorns in this sector (like IndigoAg, Solugen, Zume, and most recently LanzaTech in early 2022).
Additionally, as detailed in our report below, the growing pace at which new investment firms and startup companies focused on Circular Carbon begin to launch confirms that the urgency to address the state of our earth is perhaps beginning to be more important and attractive than alternative ways to make money. Similarly, the flowering of catalyst organizations whose main mission is to support the development of the Circular Carbon sector (like CCN) further reinforces this momentum.
Across global policy this year, we also saw meaningful, if incremental action at the COP26 gathering, where several promising commitments around the phasing out of fossil fuel subsidies and coal were made. The EU announced a “European Green Deal” to achieve Net Zero emissions by 2050, which will require a massive scaling of Circular Carbon solutions to meet. In the US, as referenced above, the Biden Administration committed billions to carbon removal technology in the US Infrastructure Investment and Jobs Act that passed this fall. Additionally, the IRS released their much anticipated guidance on how to implement the 45Q federal tax credit for carbon capture, utilization, and sequestration.
The scrutiny around solution efficacy also grew. Early corporate carbon removal buyers (like Microsoft and Stripe) published in depth research on what they bought and why. XPRIZE also published its technical validation findings. More and more analysis done by highly respected scientists are now being publicly reported about new and existing solutions and their potential pros and cons. Similarly, the Taskforce for Scaling the Voluntary Carbon Markets proposed updating the quality of Carbon Removal credits and standardizing reporting requirements for those engaging in carbon accounting. These types of checks and balances are critical to straighten the road that Circular Carbon solutions must travel to address climate effectively.
Ongoing Challenges
When science tells us we have approximately a decade to bend our current trajectory away from catastrophic climate outcomes, the progress we make even over a few months matters. While investors, corporates, and catalyst organizations are definitely beginning to mobilize, there is evidence that only a few billion dollars has actually been deployed into Circular Carbon solutions to date by private investors. Getting the Circular Carbon economy to scale in time to address climate change is the crux of the issue we face today.
In our view, many of the core challenges preventing more rapid capitalization and commercialization in the space relate to a fundamental lack of connectivity and understanding between actors working in Circular Carbon.
- It is currently taking potential stakeholders too long to get educated on the sector, which is stalling material action
- They are further held back by the many misperceptions around the sector’s different solution pathways, providers, emerging needs, and opportunities
- There is limited connectivity between the key ecosystem players that must collaborate to accelerate sector growth
Public understanding and acceptance of these solutions are also critical if they are to be developed to their full CO2-reducing potential and deployed at scale. Getting there must first involve broad outreach to a range of stakeholders beyond the usual technocratic circles. Executing a shift to a Circular Carbon economy is too large of an effort to be carried out by a small community of technologists and investors, and a path forward that places emphasis on equity and justice as well as cost and technical performance is likely the most fruitful.
Though the path ahead is not without its challenges, including the risks associated with any actions we take, there should be no doubt that the risks of inaction are far greater.
Critical Needs of Industry
Estimates vary about the scale of investment required to meet the climate challenge. If capital costs range between $100 to $1,000 per ton of CO2 removed, then the investment required for building 10 Gigatons of capacity would be somewhere between $1 trillion and $10 trillion. To put this number in perspective, governments spent more than $12 trillion in just the first six months of the COVID-19 pandemic to protect society from further catastrophic damage. To think about it another way, the amount of capital needed to build this carbon removal capacity is 1-10% of global annual GDP.
The wholesale transformation of our energy and materials economy requires a shift in our global systems at an unprecedented pace. Unlocking the embedded value in carbon through the transition of a linear to a circular economy is currently the opportunity of our generation. While there are many uncertainties around technologies, markets, and impact, there is little question that this will create a new asset class for investors.
Call to Action
As you will see in the report below, innovators and quality entrepreneurs are entering the sector at an increasing pace, creating and maturing exciting new solutions. As we will show, investors are also beginning to take note, with “climate tech,” “carbontech,” and “carbon removal” now becoming recognized, even popular, investment themes. There is no longer any excuse not to have a plan.
To continue the strong momentum of 2021, the Circular Carbon sector requires continued movement on several fronts:
- Act with Urgency: The COVID-19 pandemic has shone a harsh light on what happens when we fail to prepare for a known threat, while also demonstrating how quickly business, government, and society can act if determined to do so. When science tells us we have approximately a decade to bend the climate curve away from potentially catastrophic climate outcomes, the progress we can make (or fail to make) over even a few months matters.
- Find Where You Fit: It is increasingly hard to imagine a type of organization or sector that the Circular Carbon challenge and opportunity doesn’t touch. This is not some other person’s or organization’s problem. Be proactive and find solutions you think you might be able to test and advance – whether through your capital, expertise, infrastructure, market reach, or other capabilities – and ask what you can do to help. Don’t make individual entrepreneurs and new, fragile companies carry all the water for humanity’s future alone.
- Partner with Other Leaders: Cross-organizational, cross-sector, public-private collaboration will be absolutely critical to scaling the Circular Carbon economy in the limited time we have. Not only does that help spread the risk-taking that is required (see above), but it lends vital resources to potential solutions and accelerates the broad distribution of learnings about what works, what doesn’t, and how to get there faster.
- Invest Now: For all the reasons above, putting real skin in the game now (whether financial, organizational, reputational, or otherwise) is absolutely critical. In order to achieve the huge scales required in the coming years, we need to immediately start bringing potential circular carbon solutions down the cost curve, developing supply chains and routes to market, and demonstrating that these solutions, and the economic opportunities and jobs they create, are real. Investing relatively moderate amounts of capital now at relatively high costs per ton of CO2 removed or cycled is vital preparation for society to learn what works and what doesn’t. Today’s investments will shape tomorrow’s investments, which will be increasingly massive, with increasingly higher stakes for humanity and the planet.
We hope you find this Report useful in your efforts to address these critical needs.
INNOVATOR AND DEAL LANDSCAPE
About the Index
Climate innovators are the lifeblood of the Circular Carbon Network. The focus of the Network is to increase investment and commercial interest into these innovative companies. By bringing in-depth information together in one place about these innovators, our goal is to provide a data-rich resource for educating the market and mobilizing more active engagement.
We analyze innovators working in Circular Carbon through several criteria. First and foremost, the solution must be a Circular Carbon one – in either carbontech or Carbon Removal. From there, we look for companies that are at least engaged in the pilot phase of their project, which can mean they have an active demo or have secured seed or pre-seed funding.
By laying out key details about these companies and their status, pathways, and needs, we aim to provide market participants with a disciplined guide to the Circular Carbon startup landscape.
While the Innovator Index focuses on characterizing the rapidly evolving and growing solution provider landscape across a broad variety of practical, technical, and commercial dimensions, the Deal Hub is designed specifically to address the needs of capital providers and features investor-relevant information about live investment opportunities. Through these databases, we catalyze action by helping:
- Investors find Circular Carbon companies that fit their thesis
- Entrepreneurs feature their company to a capital audience
- Corporates identify potential startup innovation partners
Both databases include data gathered directly from companies via targeted surveys and through the review of public information by our research team. Because of our US location and the US and European location of many of our data partners, these databases are weighted towards North America and Europe, though we are working to expand our coverage of innovators from other global regions. We welcome your nominations of companies to add to the Innovator Index or Deal Hub. Despite these limitations, we believe we have compiled the largest public databases of Circular Carbon innovators and deals, ever. We hope you find them, and our analysis of the data we have gathered so far below, useful.
Data Snapshot
403
Companies
38
Countries
$3.1 Billion
Capital Raised
221
Deals Tracked
$817 Million
Investment Opportunity
We envision a future where we never again pull fossil carbon from the ground. We see a future where carbon is circular: harvested from the air... to produce new products using clean energy… That future is cleaner, quieter… and distributes resources more equitably.
Innovator Index Overview
Company Formation Picking Up Pace
Of the companies we have founding year data for, 52% report they were established in 2015 or later. In fact, 9% of all companies with founding year data were started in 2021 alone! As the Index will surely capture more innovators founded this year in the future, there is a clear upward trend of company formation in the Circular Carbon space. Still, it is important to remember that 25% have been around for 10 years or more, so the Circular Carbon ecosystem also has a significant cohort of more mature companies.
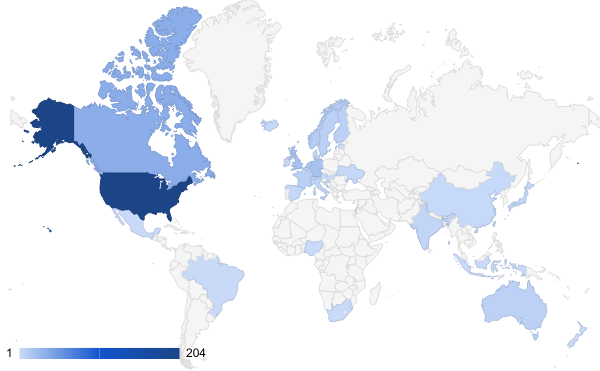
Increasing Geographic Diversity, with Some Blind Spots
The number of countries represented in our Innovator Index increased to 35 (from 27 last year) – with the majority of these additions coming from Europe. While we saw some new additions from South America and Asia as well, most of the Index remains weighted toward innovators from North America and Europe, which is both a reflection of where there is significant start-up activity and where we have more on-the-ground market intelligence. We look to continue adding in innovators from under represented continents, particularly Asia, Africa and South America. You can nominate a company or add data here.
A Sample of Companies in the Database
SOLUGEN
Solugen is a venture-backed biotech startup that produces high-performance chemicals from plant-derived substitutes
BIOCHAR NOW
manufactures and sells biochar to private sector, governmental and industrial markets.
ECOCELL TECHNOLOGY
Makes a novel composite material based on bamboo and paper to replace concrete and thereby absorb and store CO2 on a large scale.
TWELVE
eliminates emissions by turning CO2 into essential products, such as lenses, auto parts, and chemicals.
SKYRE
SKYRE’s CO2RENEW captures and converts carbon dioxide into useful fuels and chemicals
SYNHELION
uses concentrated solar heat to turn CO2 into fuel
PONDTECH
Uses CO2 to grow algae for nutraceuticals, food coloring, or animal feed or as petroleum substitute feedstock for bioplastics, biofoams, cosmetics, or biofuels.
CALYSTA
converts methane into protein and feed for animals and aquaculture.
Technology Dimensions
This year, we made a significant effort to add more “Carbon Removal” (durable removal of CO2 from the atmosphere through technological, biological, or geological mechanisms) companies to our Index on top of the “Carbontech” (technological carbon capture, utilization, and sequestration) focus we started the Innovator Index with in conjunction with the Carbontech focus of our partners at XPRIZE. This year, we added several new solution types, including Geologic Sequestration, Biologic Sequestration, and Market Infrastructure categories.
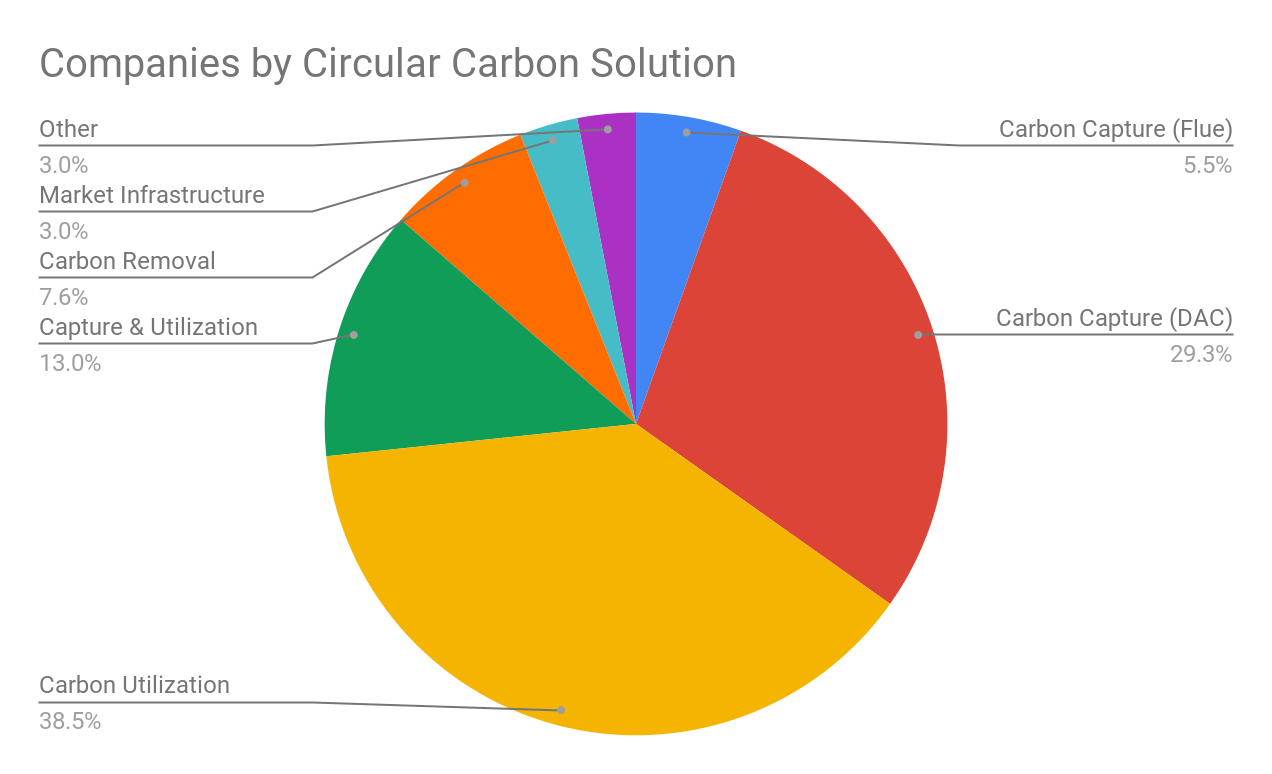
Increased Carbon Removal Coverage, Continued Carbontech Growth
In 2021, Carbon Utilization remains the most common Circular Carbon Solution Category in the Index (39% who responded to our survey are pursuing Utilization). Even though we added more Carbon Removal companies, this actually represents a 14% proportional increase in focus on Utilization since 2020, showing sustained and growing in those approaches (CO2-to-building materials, fuels, polymers, etc.). At the same time, the proportion of companies indicating they are pursuing BOTH Capture & Utilization has decreased significantly from 41% to 13%, perhaps indicating a trend towards specialization as the ecosystem matures.
Finally, across the Carbon Removal categories, we saw a real increase in Direct Air Capture (DAC) as a solution type being pursued by innovators compared to 2020. This year, DAC represents almost a third of all solutions being developed by companies in the Index for whom we have solution category data.
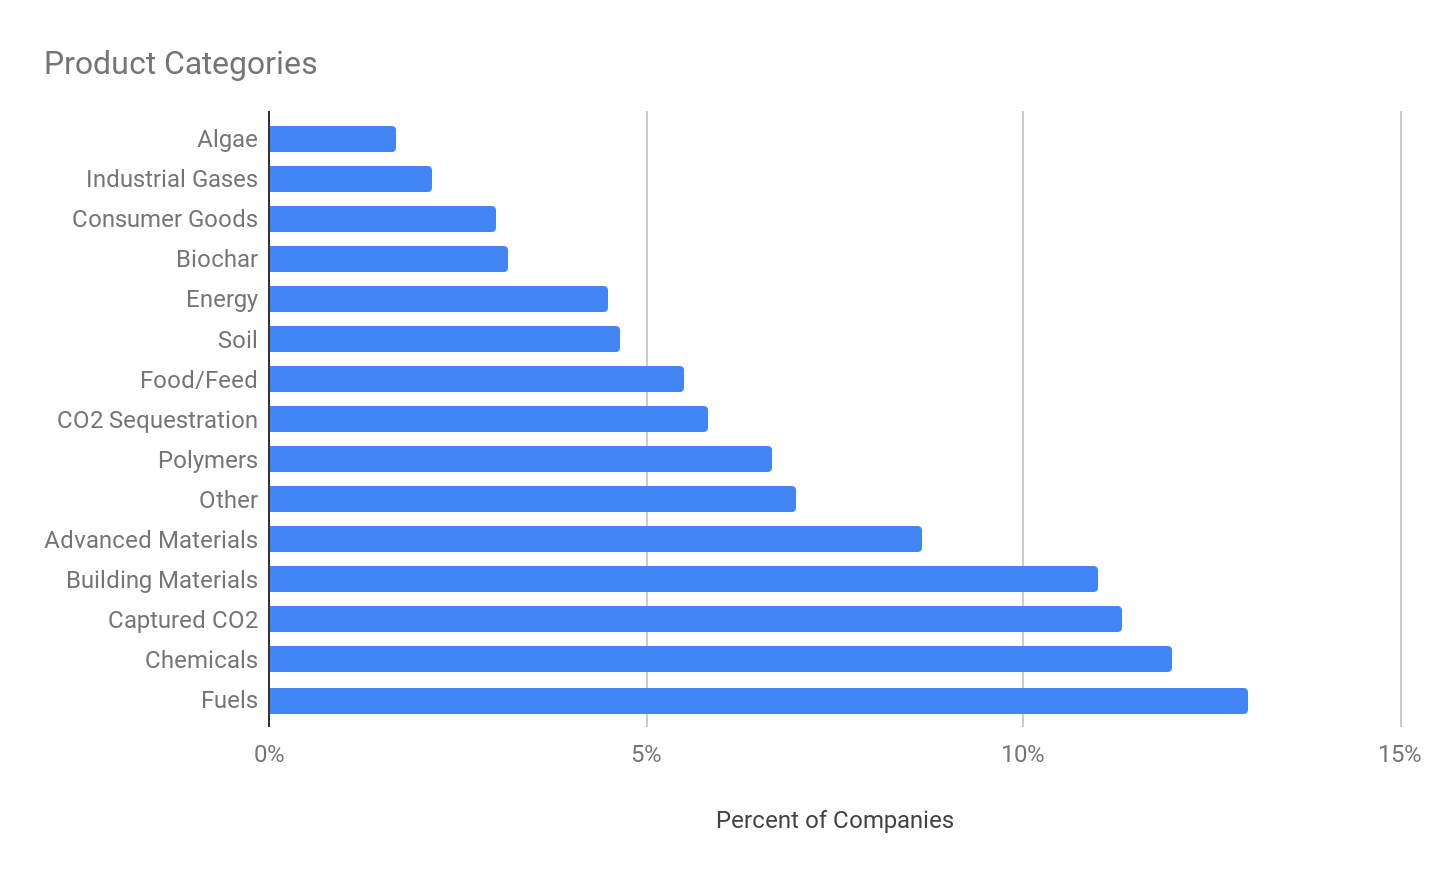
Increasingly Diverse Product Pathways
Looking at the macro category of product that is being made by companies on our Innovator Index (versus the macro category of Circular Carbon solution that is being pursued, per the above), we find a quite diverse mix of product pathways. Like last year, Fuels (13%) and Chemicals (12%) are clearly the most common individual product categories, followed by Building Materials and Captured CO2 (11% each) and Advanced Materials (9%). Work in the latter two categories (Captured CO2 and Advanced Materials) has doubled in the Index from last year, even as we added over 150 new companies. This again supports the macro trend of continued growth of entrepreneurial activity in Carbon Utilization that we saw in the Circular Carbon Solution Pathways data above.
New this year, however, and reflecting our effort to expand the lens to the broader Carbon Removal and Sequestration landscape, we are also seeing an increased and significant number of companies pursuing the natural product pathways, such as algae, biochar, and various forms of forest-based and land-based sequestration (21% of all companies in the Index for whom we have this information).
Specific Product Examples
Fertilizer
Global Algae Innovations, Inc.
Livestock Feed
Fuel
Edible Proteins
Insulation
Biochar
Animal feed
Polymer feedstock
Resin
Building Materials
Calcium carbonate
Calcium chloride
Calcium oxide
High-purity CO2
CO2 Removal Credits
Hand Sanitizer
Urea
Carbonic Acid
Carbon nanotubes
Synthetic graphite
Graphene nanoplatelets
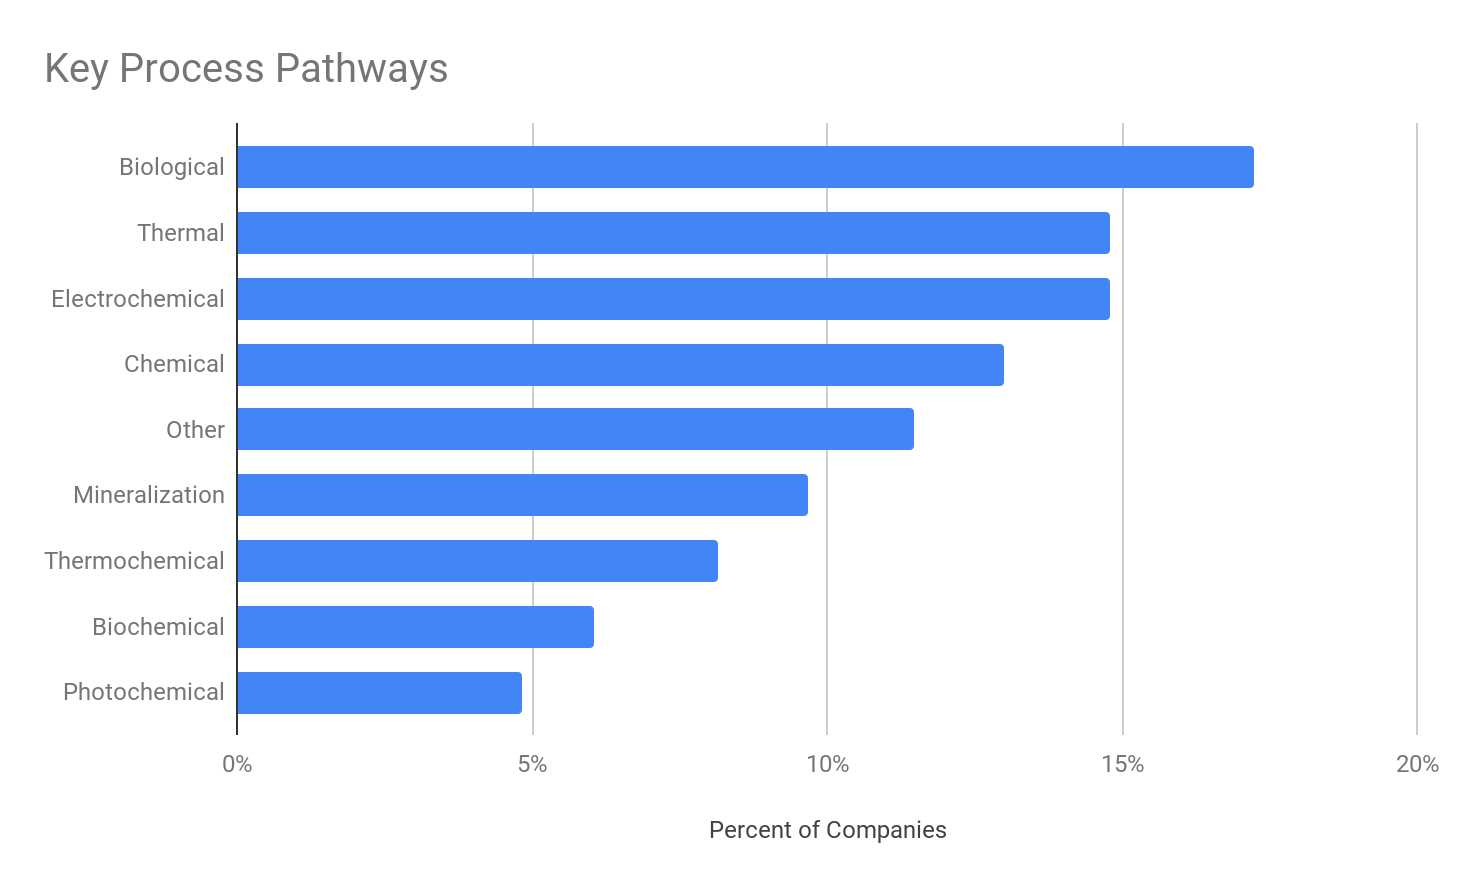
Broad Mix of Process Types
While companies are pursuing many technology process pathways, Biological processes dominate (17%), followed by Thermal processes (15%) and Electrochemical processes (15%). Even as our Innovator Index has grown by (150) companies, the distribution of process pathways remains very similar to 2020.
Core Innovations
Like entrepreneurs in every sector, the companies in the Innovator Index are working to bring differentiated, advantaged solutions to market. We asked each company on the Index to describe their core innovation both to help us understand and categorize them as well as to help potential investors and commercial partners evaluate the advantages of a particular company’s approach. Here are just a few examples of companies’ core innovations in their own words…
Chemical : C1Chem
“The technology that [C1Chem] possesses is the “CO hydratase system,” [which] can directly convert carbon monoxide to formate.”
Mineralization : Cambridge Carbon Ltd
“Low energy process to produce magnesium oxide from abundant ultramafic rock enabling its use to capture CO2 as magnesium carbonate.”
Thermal : Lingrove
“Lingrove’s breakthrough is in the formulation and continuous processing of natural fibers and thermoset/thermoplastic resins to create a material with aesthetics reminiscent of old growth wood, while maintaining the performance characteristics such high-performance composites as glass and carbon fiber-reinforced polymers”
Integrated Innovation : WAI Environmental Solutions
“SynolysCarbon and Synolys® is a technological process that integrates four technologies (drying, pyrolysis, tar removal and Synolys® bioreactor) and is used to treat waste streams and produce renewable energy (biogas) and carbon storage material (biochar).”
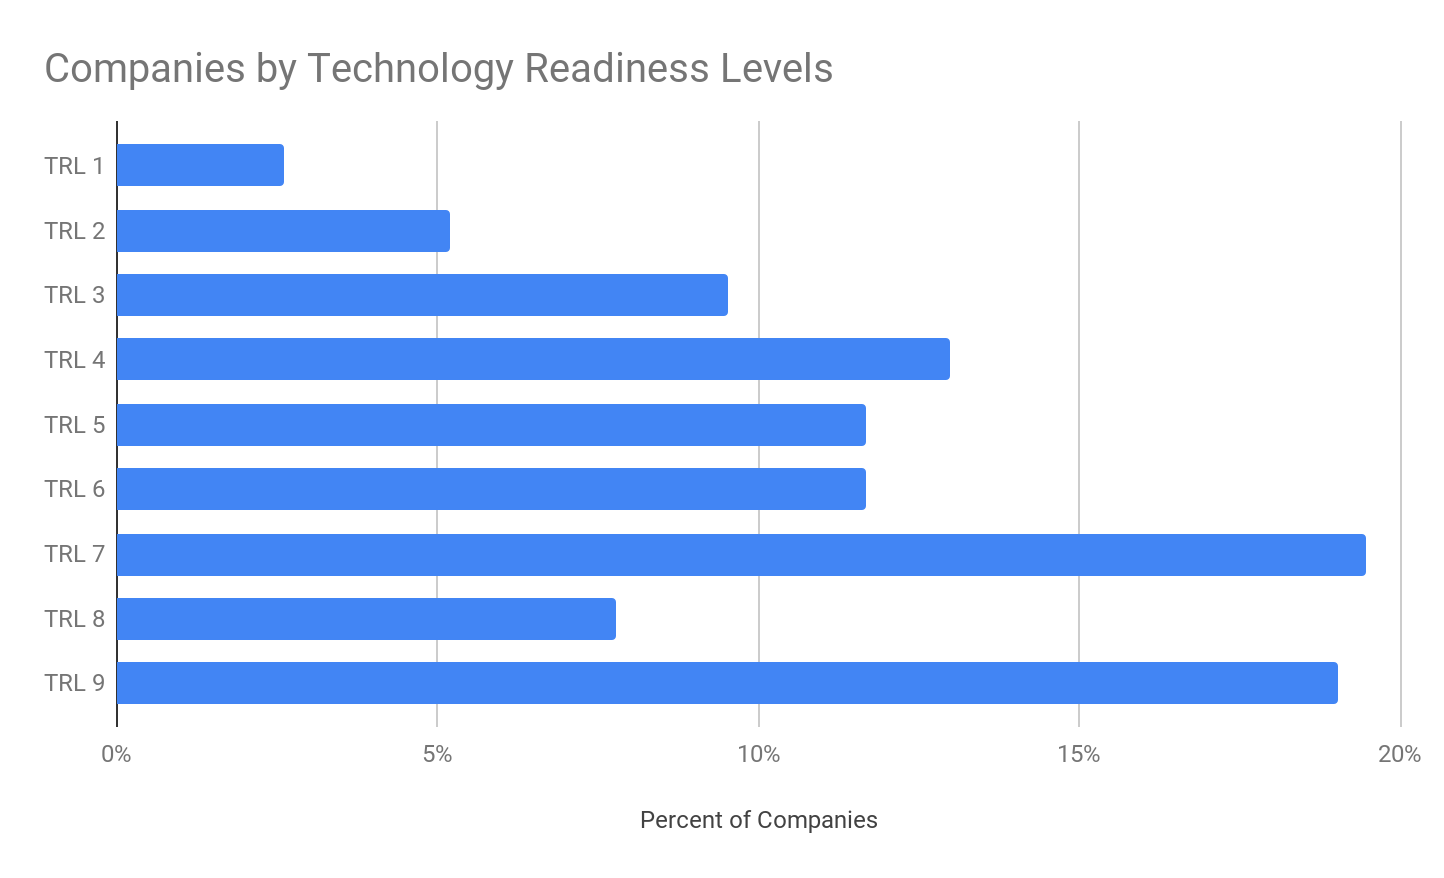
Wide Distribution of Technology Readiness, Including Growing Cohort of Mature Companies
While we saw almost double the amount of companies reporting their U.S. D.O.E Technology Readiness Levels in 2021 (231), the distribution of technology readiness in our Index stayed almost exactly the same as in 2020. Specifically, as one might expect for a rapidly emerging sector, 42% of the reporting companies in our Index classified themselves with early- stage TRL’s of 1-5. However, even more (58%) of the companies in our Index classify themselves as somewhat technologically advanced at a TRL of 6 or above, and nearly half of those report as highly advanced (TRL 8 & 9). With the important caveat that this data is self-reported, this data again suggests that the Circular Carbon market is continuing to mature and has a significant segment of companies that are already more technologically advanced than may be commonly assumed.
Commercial Dimensions
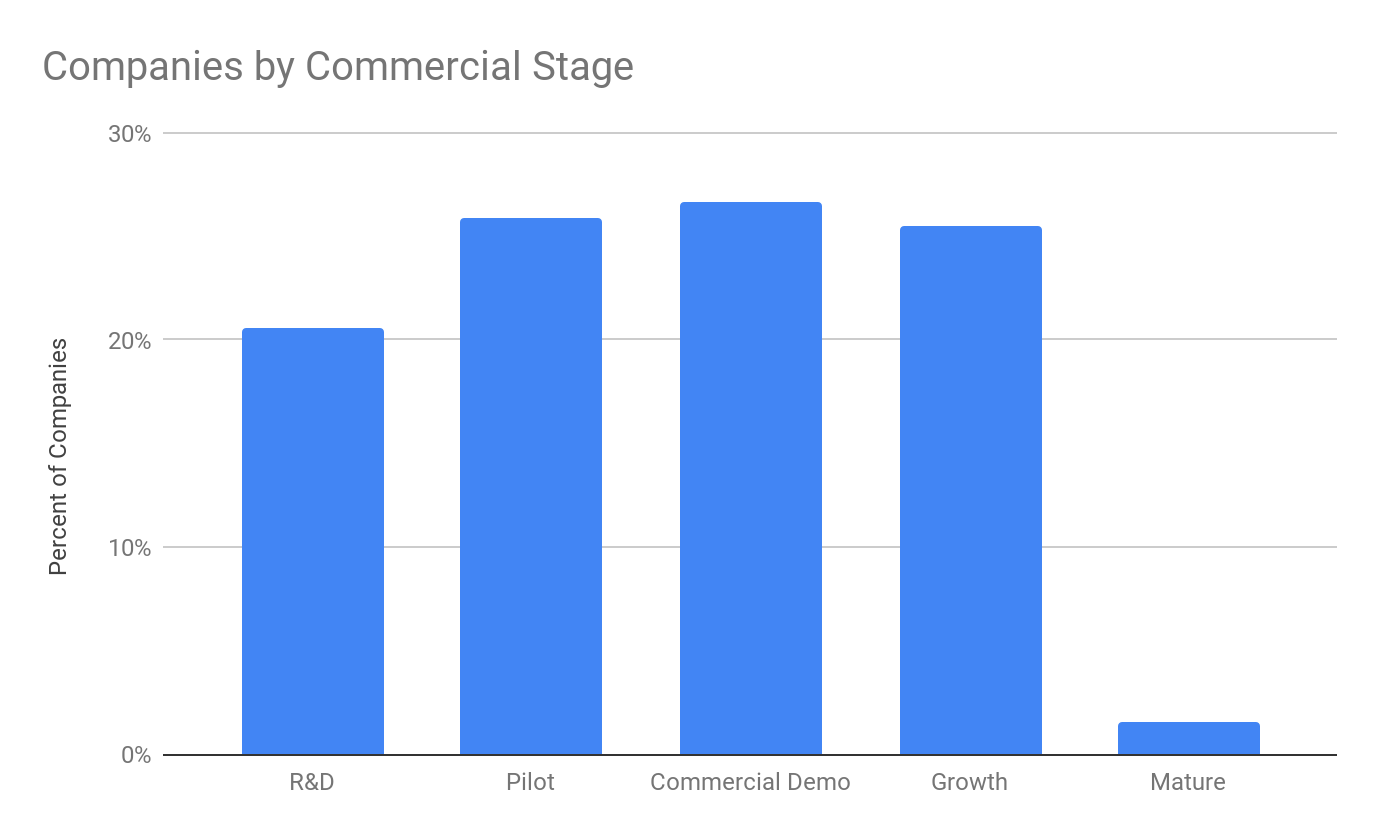
Companies Also Maturing in Commercial Readiness
As more companies come online in this space, we are seeing an increase of those in the Research & Development (R&D) phase. If we analyze companies in the R&D stage by year founded, we see 77% of them were founded in 2021 and 30% in 2020. At the same time, we are also reporting a slight increase in companies in the Commercial Demo phase. Overall, over 77% of all companies in the Index have advanced beyond R&D and are actively commercializing.
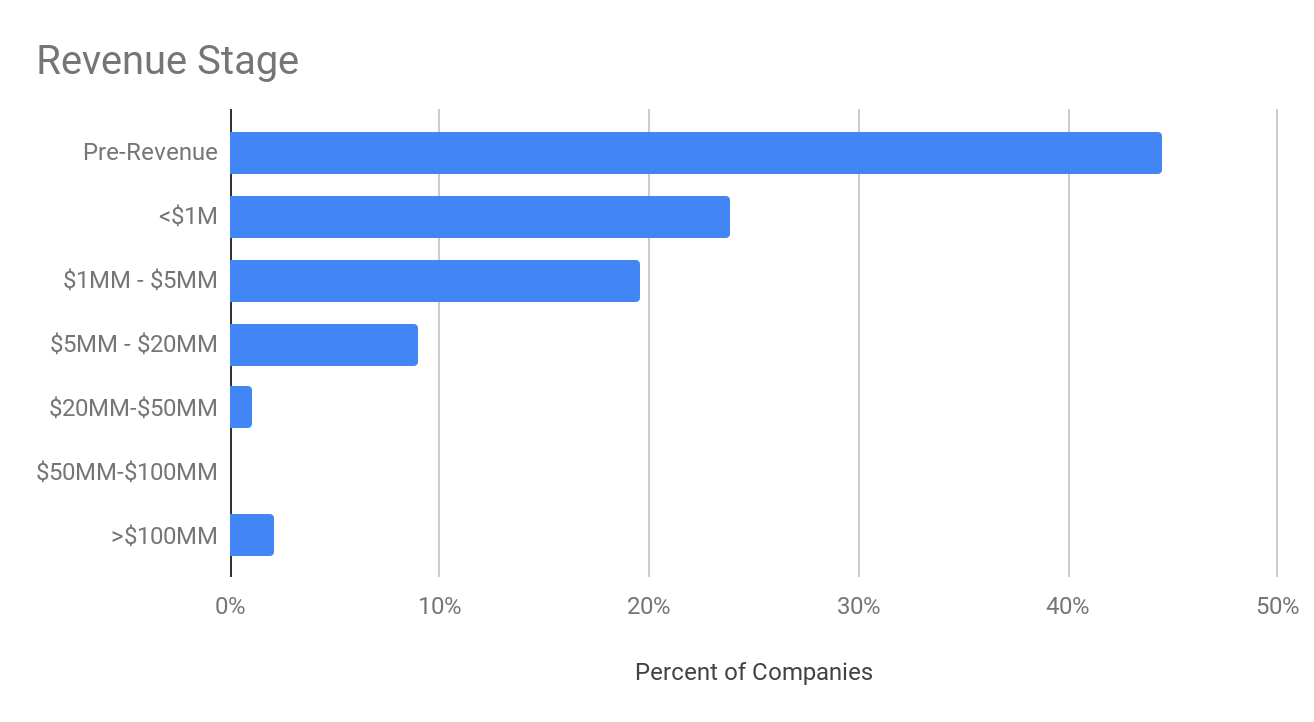
Growing Revenue Traction
Of the companies that we have revenue information on (189) 56%, or 105 companies, are already generating revenue. Of those, over half (60 of 105) are generating over $1MM. At the same time, 44% are still pre-revenue. Because revenue is reported in ranges, the total revenue reported by companies in the Index who supplied this information ranged from $562MM to $1.425B. It’s worth noting, however, that we only have this data for 45% of the companies in the Index (185 of 403), so the actual range is probably significantly higher.
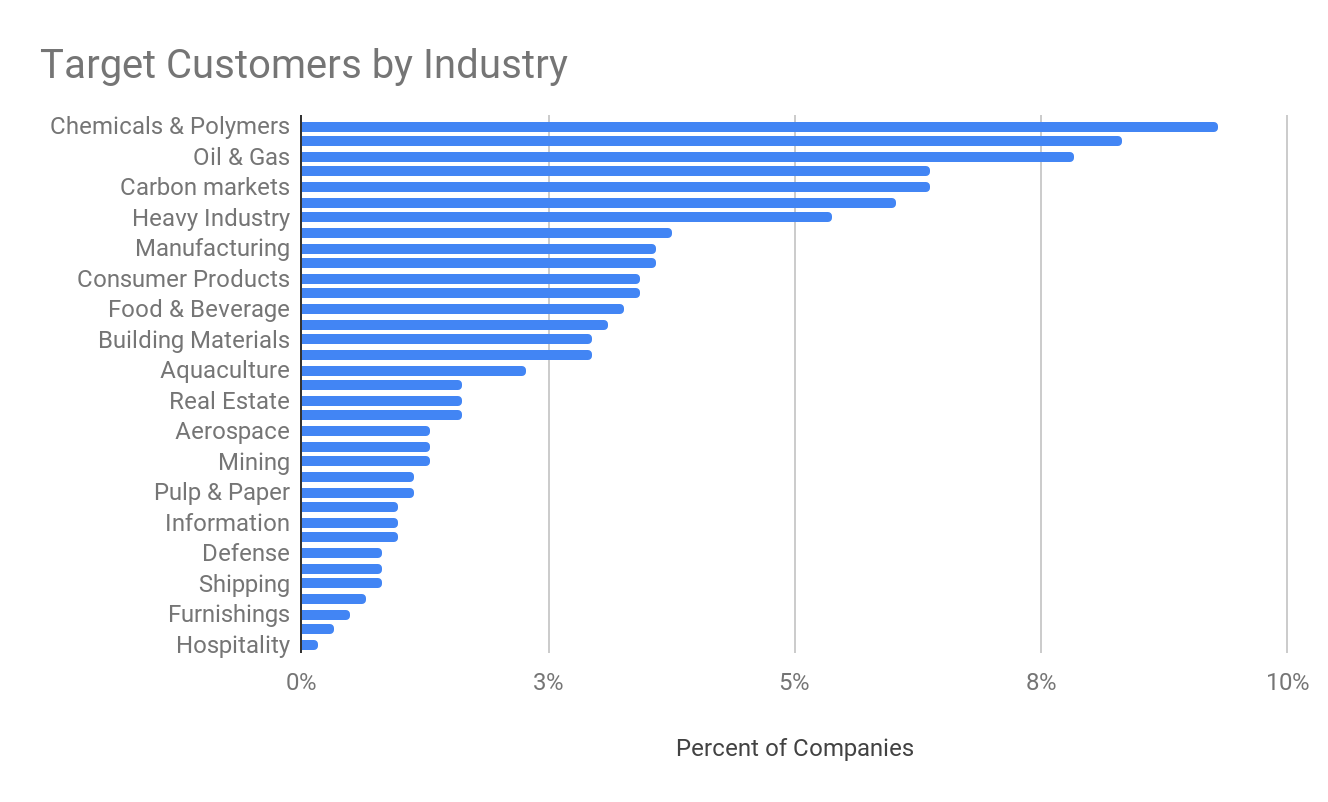
Evolving Customer Mix
We surveyed companies about their target customer industry to further understand the potential customer bases of solution providers in the Index. In expanding our data to include Carbon Removal, we added several target customers to reflect a diversifying industry – from aquaculture to forestry. However, and not surprisingly, hard to decarbonize, energy intensive sectors like Oil & Gas, Chemicals, and Building and Construction are the most common target customer industries for innovators in the Index. Agriculture and Carbon Markets are also newly popular target customer industries, likely representing the growing demand for carbon offsets.
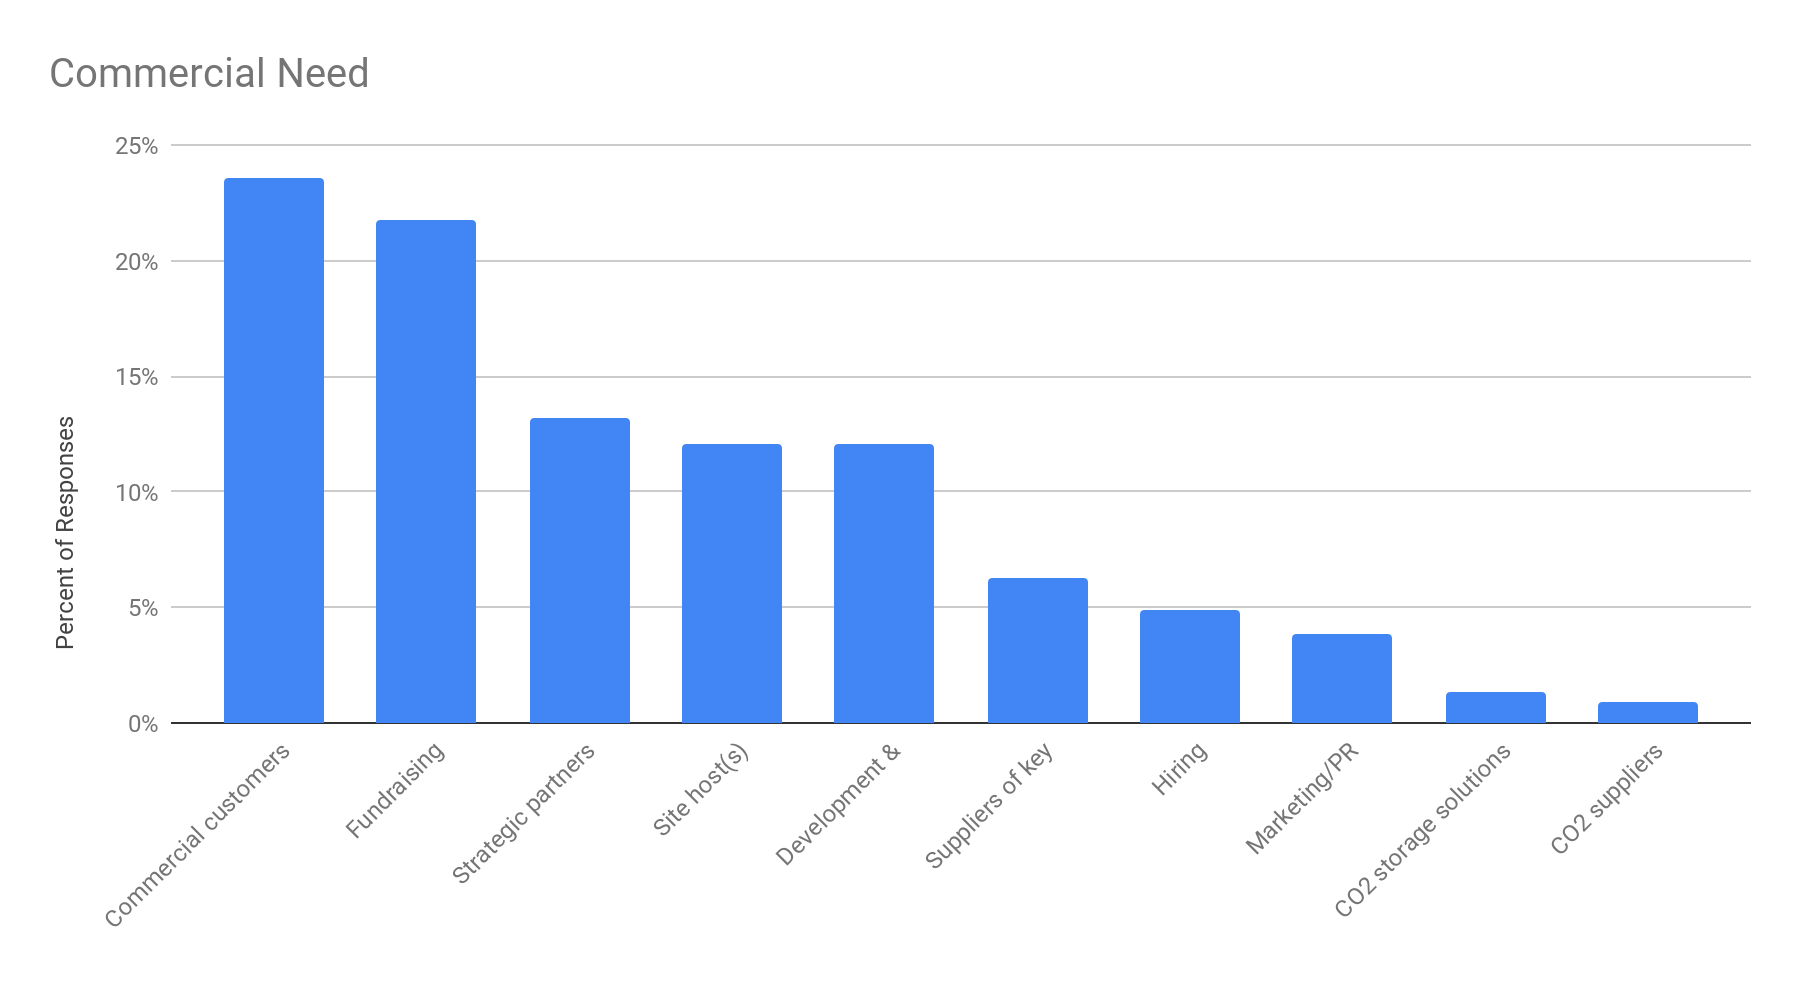
Commercial Customers and Funding Partnerships Sought
To better clarify where potential partnership opportunities lie, we asked innovators for their current top commercial needs. In diversifying this category of responses, we added several tactical options (like hiring and PR), as well as more in depth partnership questions. It will come as no surprise that solution providers are seeking commercial customers (24%) and fundraising (22%), first and foremost. There is also a need for site hosts (12%), key partners for development (12%), and suppliers of key components (6%).
Examples of Commercial Needs Expressed by Innovators
Here are several examples of the specific needs technology developers on the Index told us they have in their own words. They are highly varied and very evocative of entrepreneurial businesses working to build their foundations for growth:
Customers:
“We are looking for commercial customers to begin offtaking carbon removal credits from our first commercial deployment.”
Pilot Funding
“Our goal is to scale up our technology from TRL6 to TRL8, a 1000 tonCO2/year prototype. We have preliminarily engineered the prototype and are looking for funding to advance our project.”
Project Host
“We are looking for a host site close to or onsite with CO2 injection and with potential renewable energy offtake (wind, solar, geothermal) for our first deployment.”
CO2 Storage
“Our current model does not qualify for permanent storage, [so] we are looking for partnerships with storage solution providers”
Manufacturing
“We are seeking partners to help us scale rapidly by repurposing their compounding equipment to produce [our plant-based polymer]”
Regulatory Approval
“Approval for an ocean test site is a significant hurdle and this is required before we can make further significant progress.”
CO2 Removal Verification
“Biggest Challenges:… Third party validation of net negative carbon emission reduction at various scale milestones.”
Kitchen Sink
“We are fundraising to proceed to proof-of-concept pilot phase. This would bring us from TRL2 to TRL6. We are also looking for partners who can help us develop business side of our enterprise, and also for a partner that would host the pilot plant.”
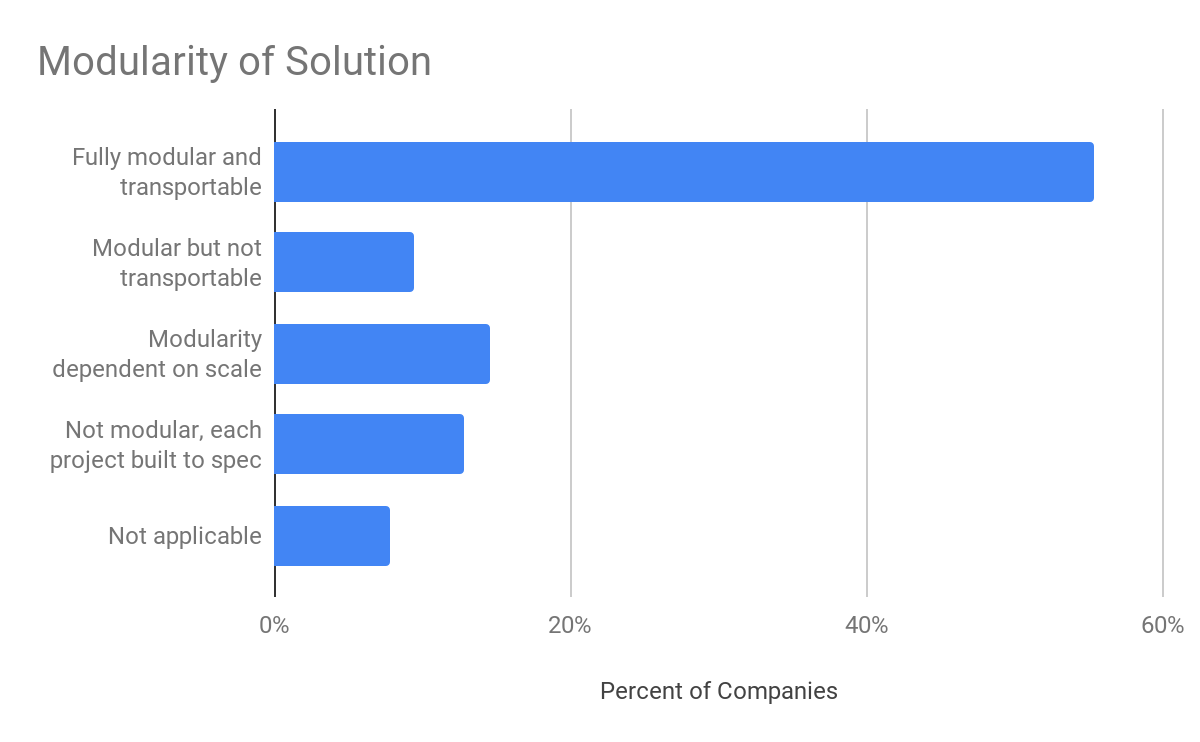
High Degree of Modularity
Over half of solution providers report their products and technology to be fully modular and transportable. Highly modular solutions can be deployed and distributed at multiple scales and still be cost effective. Less modular solutions can also be profitable and impactful at large scales.
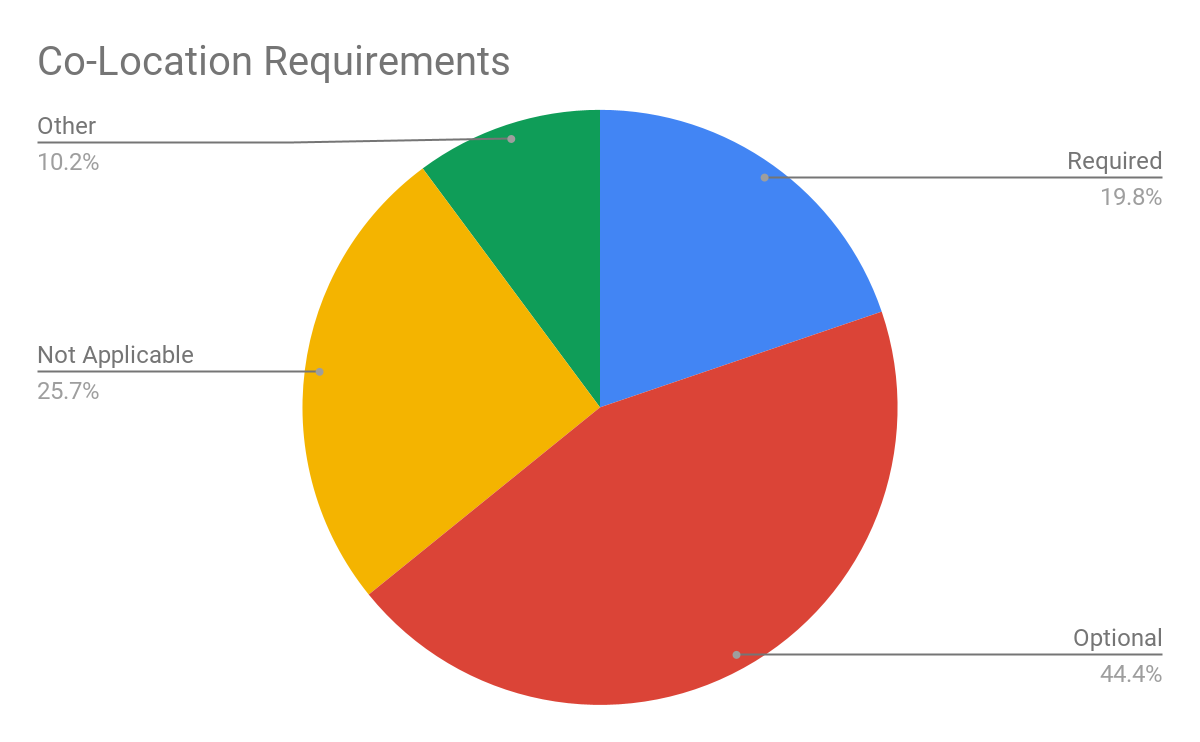
Co-location Optional
Being co-located with existing industrial plants can indicate a highly effective Circular Carbon solution, as these facilities emit most of the world’s CO2 emissions. Additionally, they have a lot of the infrastructure that innovators might need including heat, power, and the carbon emissions in a concentrated form. However, these types of integrations can be complicated and expensive, as well as burdened by regulatory and institutional barriers. Most innovators state that co-location is optional or not relevant to their solution.
Capital and Investment
Significant Increase in Capital Raised
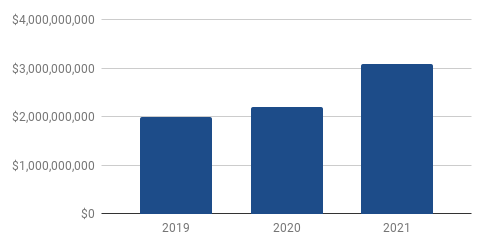
We were able to identify investment-to-date totals for 185 out of 403 companies in the Index. These companies have raised approximately $3 billion so far. In terms of trends, we were able to track a significant increase in total capital raised since our 2020 report, totaling an increase of $884 million. For comparison, the amount of reported capital raised between 2019 and 2020 was $220 million. This influx of capital raised aligns with the surge of interest we are seeing in the Circular Carbon space generally.
We also analyzed capital trends for companies added to our Index in 2021, where we weighted the reported capital growth to the number of company additions. Here we found a 307% increase in investment per company compared to 2020, which indicates slightly fewer, but significantly larger deals happening over the last 12 months.
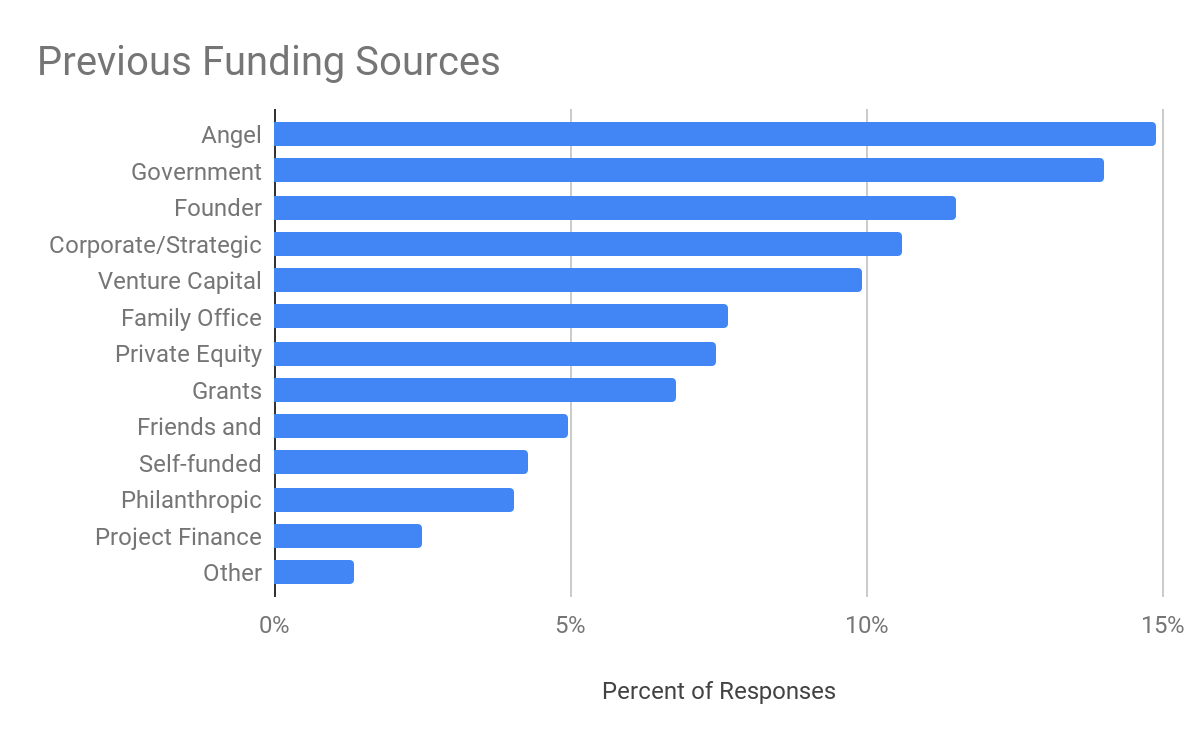
Capital Sources Broadening, but Still Predominantly Non-Institutional
Although we are seeing a broader distribution of funder types than in our 2020 data, Angel and Family Offices still represent the most common funding type (22% combined). Institutional investors overall only increased as a funding source by 6% from last year. While that may be a sign of growing institutional interest in the sector, non-institutional capital is still the leading source for Circular Carbon innovators. Additionally, Founder funding (11%) is a new and significant category this year, perhaps indicating that founders are increasingly confident in investing their own capital.
Sample Investors
Bill Gates
Grantham Foundation
Baruch Future Ventures
Kapor Capital
Lowercarbon Capital
Zero Carbon Partners
Galvanize
National Science Foundation
Federal Government of Canada
Korean Government
Spanish Government
Emissions Reduction Alberta
Chevron Ventures
NRG
Occidental Petroleum
Oil & Gas Climate Initiative
Saudi Aramco Ventures
Mitsui & Co. Global Investment
BHP Ventures
BMW i Ventures
Breakthrough Energy Ventures
Techstars
Chrysalix Ventures
Evok Innovations
Roda Group
Lionheart Ventures
Earthshot
Aera VC
Investment Opportunities
About the Deal Hub
The Deal Hub lists both “corporate” investment opportunities (investments into companies) as well as project investment opportunities (investments in specific deployments), though to date, as shown below, it has been weighted toward corporate-type investments.
The information on the Deal Hub is supplied by the offering entity (e.g. start-up or company or project sponsor). Once a deal has gone 60 days past the “Anticipated Closing Date” as indicated by the company, it is moved from the “Active Deals” list to the “Historic Deals” list.
Meaningful Increase in Total Investment Opportunities
Our Deal Hub tracked 105 companies (roughly a quarter of the entire Innovator Index) seeking over $816MM in capital in 2021. This is a 14% increase in capital sought (by slightly fewer companies) compared to 2020. Larger capital raises by Circular Carbon companies may represent a growing confidence by innovators to take on outside capital and to scale more quickly.
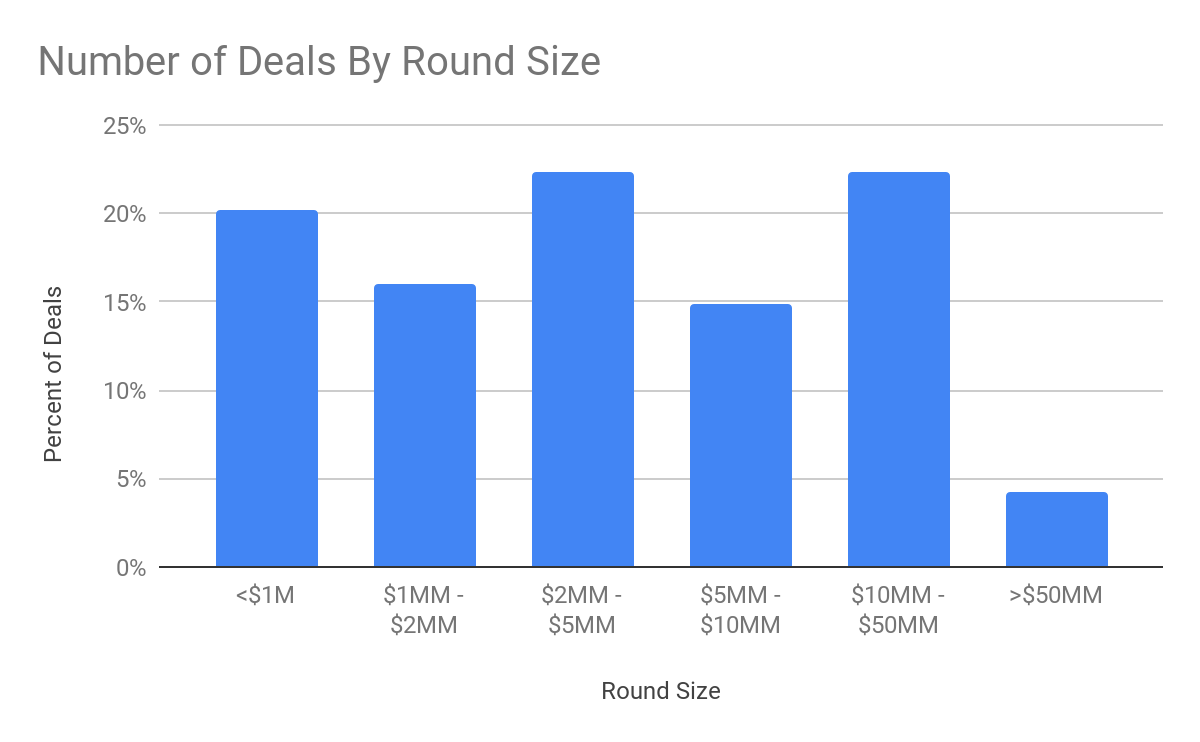
In terms of the deal size distribution, we tracked 34 deals in 2021 that are under $2MM, the majority of opportunities listed in the Deal Hub. Interestingly, we also found 4 deals over $50MM sought. The rest of the deals land between $2MM – $35MM (56). This spread of available deals sizes represents opportunities for a broad range of investors.
As of the publication of this report, 82 companies raising approximately $511M are listed as Active Deals on the Deal Hub.
Overall, we are seeing an increasing pace and larger round sizes in the live investment opportunities we track.
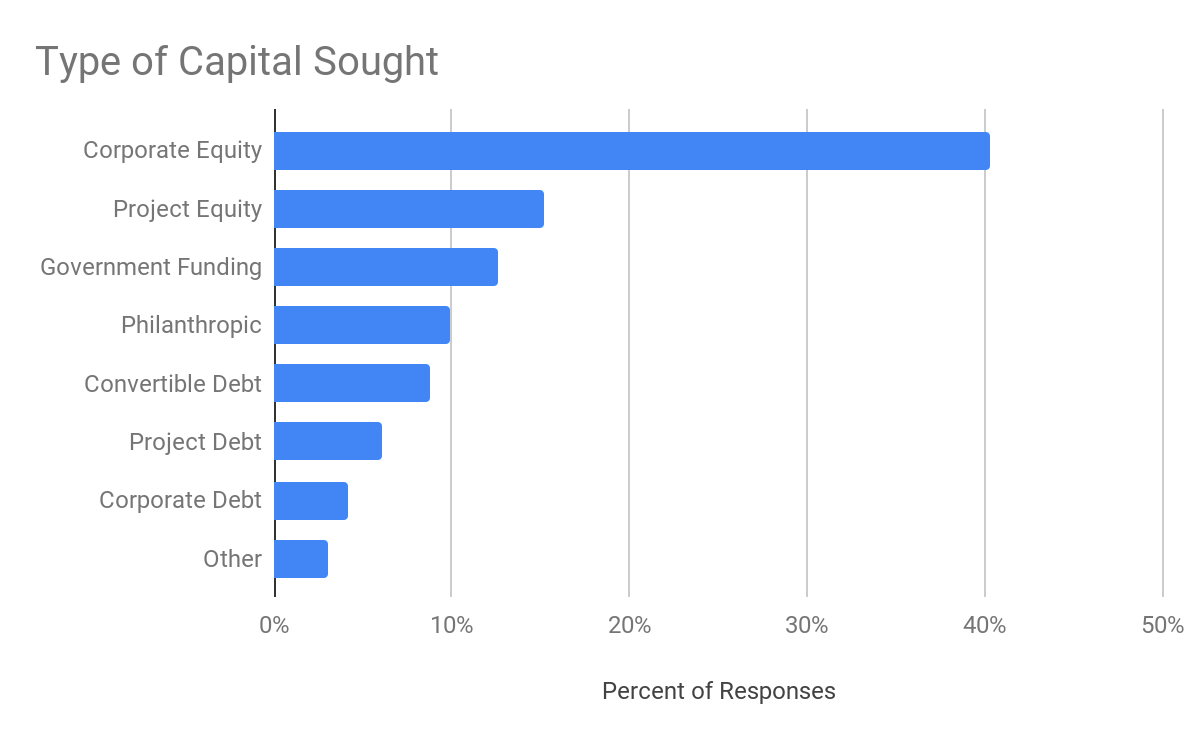
Standard, but Evolving Capital Types Sought
We are continuing to see a fairly typical spectrum of types of capital sought for an emerging sector, with Corporate Equity (106 companies, or 40%) again being the most common. However, there is a noticeable increase in companies seeking Project Equity compared to 2020, which may signify increased progress towards commercial deployment in the sector. At the same time, government and philanthropic funding appear in the Index for the first time in 2021, representing a combined 23% of the type of capital sought (from 59 innovators). This seems to represent continued (or growing) interest in non-commercial sources of capital and may indicate that commercial investors’ growing focus on the sector may be outpaced by other capital providers.
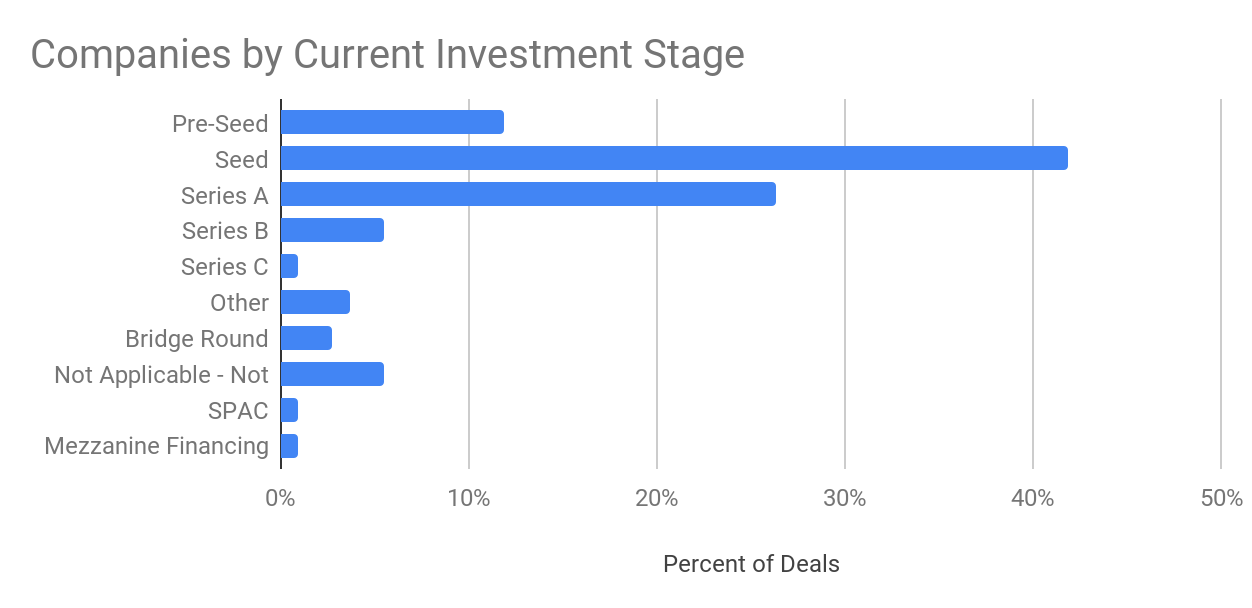
Diverse, but Early-Stage Weighted Deal Flow
As you would expect in a growing sector, over 75% of all Deals we tracked are in early investment stages, with the large majority of those seeking Seed funding. Interestingly, 45% of the “Series A” deals listed are for over $10 million, which is on the high side for a typical Series A. In addition, 16 deals are later-stage – Series B+ and include SPACs, Mezzanine, and Bridge funding rounds. The majority of all deals tracked on the Deal Hub, however, are earlier investment stages. With at least 88 companies formed in the last five years (2016-2021), this large amount of early-stage deal flow is consistent with a sector with a large amount of new entrepreneurial activity.
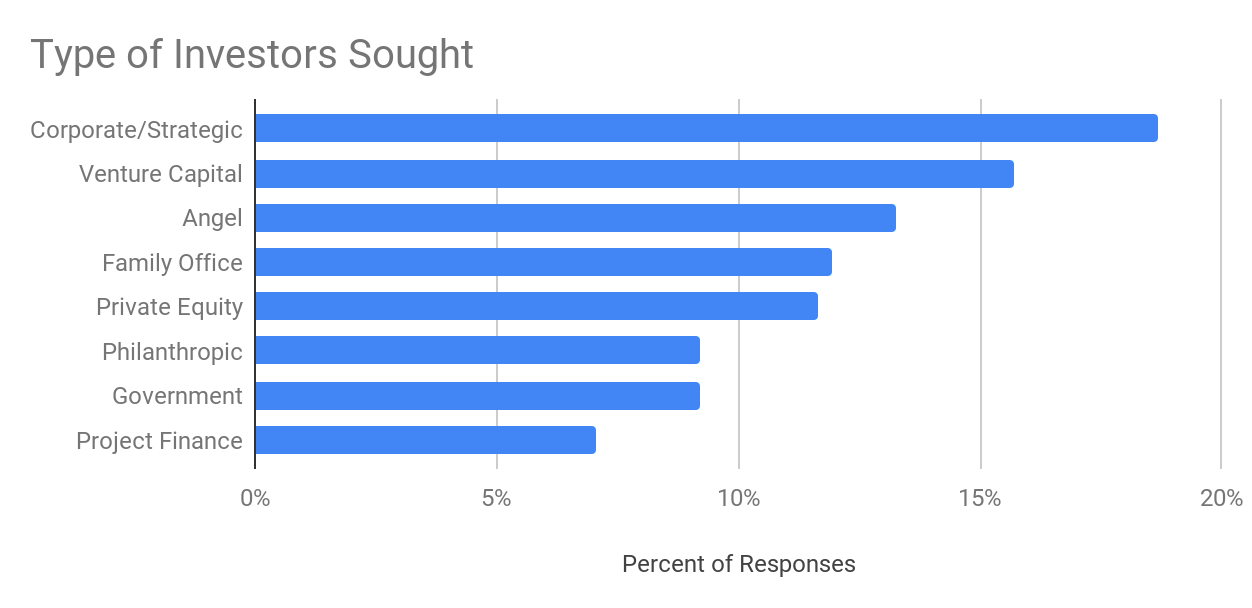
Patient & Strategic Capital Preferred
Family Office and Angel investors (combined) continue to be the most sought after type of investors within our Deal Hub. Corporate Strategic and Venture Capital are also a strong preference for innovators seeking funding. This mix is very similar to the previous two years of our analysis of this data point.
However, this year we see an interesting discrepancy relating to Government Funding, where nearly 30% say they have received Government Funding previously, but only 12% of companies in the Deal indicate that they are seeking Government Funding going forward. It will be interesting to see if this shift towards commercial investors holds in the wake of some of the historic government funding opportunities announced recently (e.g., the billions of dollars for a “Carbon Negative Shot” contained in the 2021 US Infrastructure Bill).
Overall, the current distribution of investors sought by innovators reinforces again that investors with generally longer time horizons (family offices) and strategic objectives (corporates) remain preferred (and perhaps more inclined) targets for Circular Carbon innovators than pure institutional, financially-oriented investors for the moment.
Broad Range of Deal Sizes
There is a total of $816M in deals listed in the Deal Hub in 2021, with a relatively broad range of round sizes represented. We tracked 34 deals that are under $2MM, the majority of deals we saw. Interestingly, we also report 4 deals seeking more than $50MM. The rest of the deals land between $2MM – $35MM (56). This spread of available deals represents opportunities for a range of investor types.
Valuations Increasing
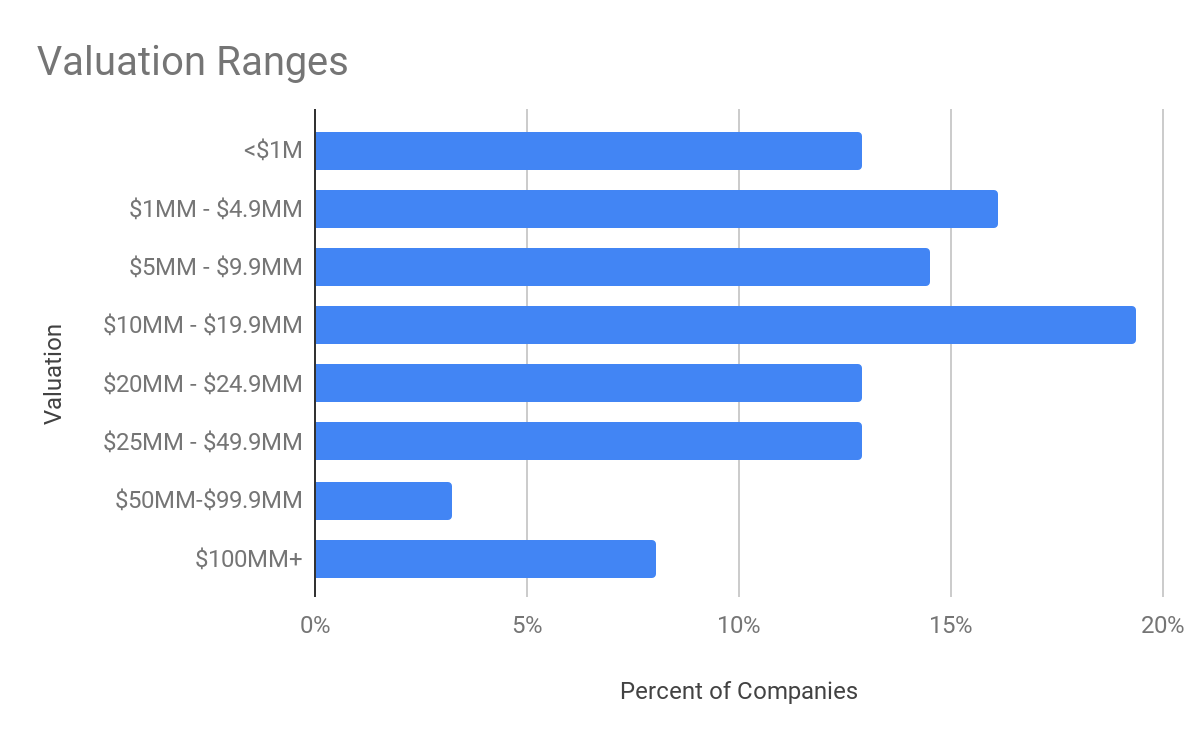
The total pre-money valuation for all the companies in the Deal Hub that listed this figure (62/110 companies) comes to over $6.9B. This is a significant increase from 2020 — by $5.4B — and likely significantly understates current enterprise values in the sector given the missing data points. This strongly suggests that the increased general interest and market activity in the sector (by entrepreneurs, investors, policymakers, and corporates) is now leading to rising valuations and increased entrepreneurial progress, something to watch carefully in the coming year(s).
In terms of the overall distribution, sixty percent of companies in the Deal Hub report a valuation of $20MM and under (39), with the other 40% reporting a valuation over $20MM. Eight companies reported a valuation under $1M, more than reported over $100M (5).
CAPITAL LANDSCAPE
Summary
About the Index
Replacing our linear fossil carbon economy may represent one of the best opportunities to renew global prosperity, reinvent the economy, and create a more resilient and just society.
The Circular Carbon economy offers investors a compelling way to combine climate impacts and economic returns (see our Market Reports Library for more data about the scale and nature of the market opportunity).
In fact, we see a growing number of capital providers – from family offices, corporates, and governments – deploying capital into Circular Carbon solutions, not only at an increasing pace but also with a longer view on returns.
Data Snapshot
159
Firms
14
Countries
$202 Billion
Assets Under Management
The CCN Capital Index tracks capital providers who are currently active or interested in Circular Carbon investment opportunities. By tracking a broad range of data about the investment profiles, preferences, and performance of capital providers active or interested in the sector, we aim to accelerate and increase the flow of capital into the Circular Carbon economy. Specifically, the Capital Index is designed to help:
- Investors build syndicates and identify potential co-investors across stages
- Investors identify potential sources of follow-on capital
- Limited Partners find active funds in the carbon sector
- Entrepreneurs find potential sources of capital across asset classes (e.g. equity, project finance, grants, etc.)
- Strategic corporate VCs identify institutional investors to collaborate with
The data for the Capital Index was compiled from a mix of direct responses by capital providers to a structured series of questions and a review of publicly available information by our research team.
Incremental change alone cannot deliver both net zero emissions and an equitable and habitable planet on the timescales required. If the financial sector seeks to enable a whole economy transition, innovative approaches to allocating capital towards the climate transition are needed.
Capital Index Overview
Growing Diversity of Investors Entering the Sector
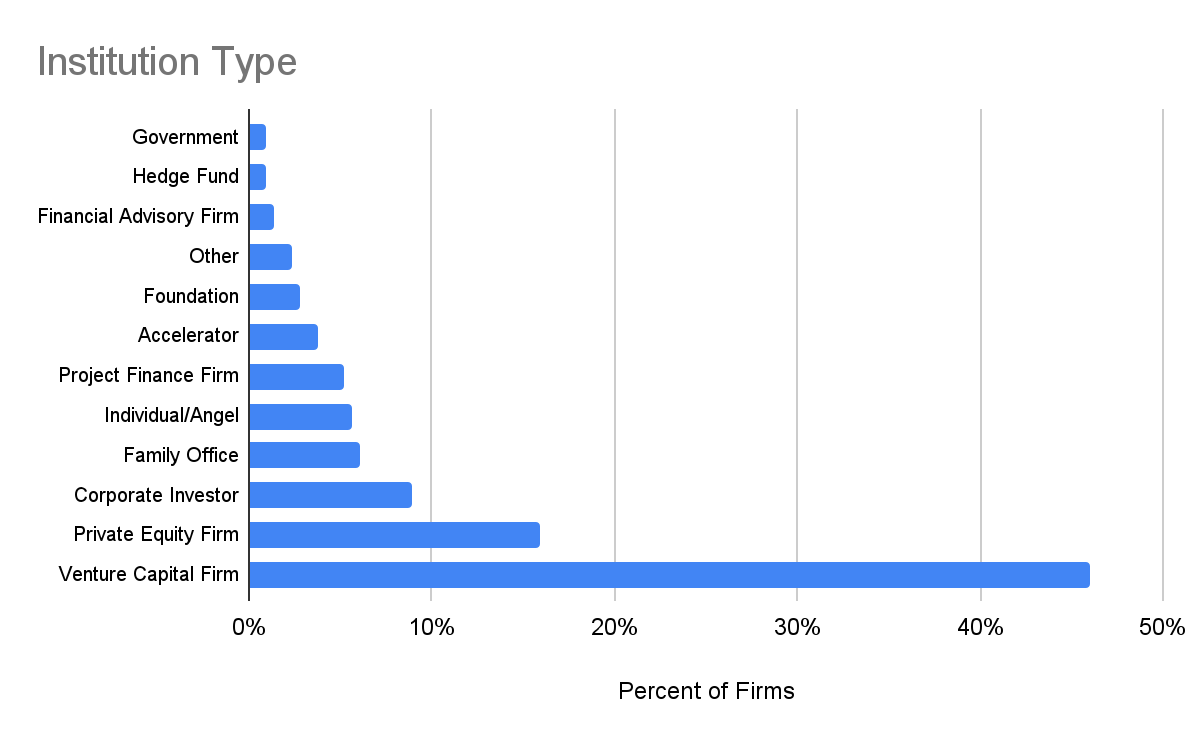
Forty-six percent of the firms in our Capital Index are Venture Capital-type institutions, a slight decrease from 2020 (when they made up nearly 60%). This is likely a reflection of our efforts to broaden our research lens as well as the growing attraction of the Circular Carbon sector to the full spectrum of capital providers.
Private Equity (16%), Family/Angel investors (12%), Corporate Investors (9%), and a diversity of other institutions represent the rest of the firms in the Index.
While we classify a clear majority of all the institutions in the Capital Index as early-stage focused firms (not surprising given the still-emerging nature of the sector), later stage investors now comprise about 24% of the firms in the index as well.
Increase in New Firms, Increase in Impact Focus
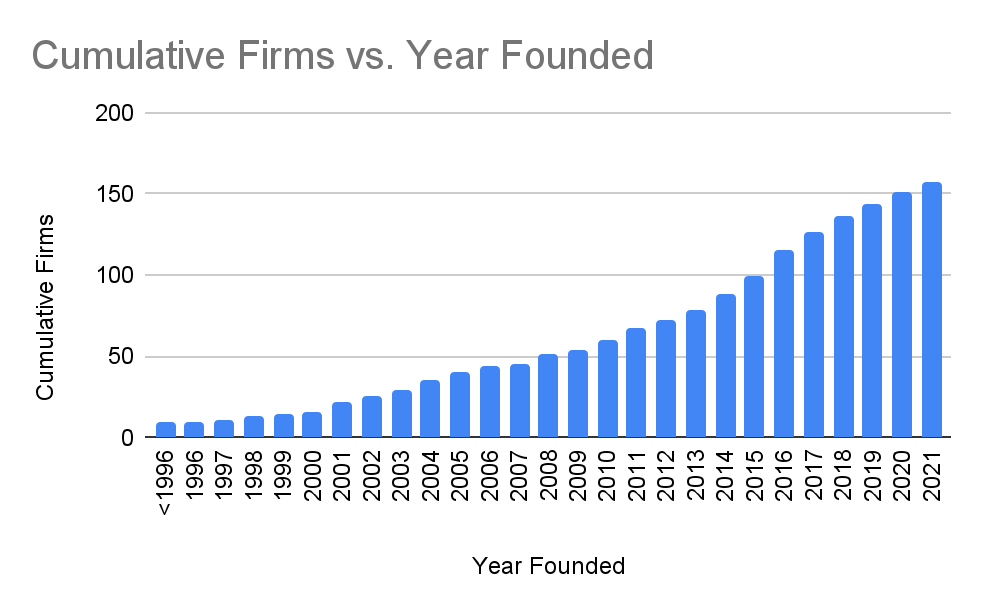
Despite the impact of Covid-19, there continues to be robust new investment firm creation focused on Climate Tech and Circular Carbon. Twenty-eight percent of all the capital providers in the Index were founded in the last five years.
Of those founded in 2021, we see a third coming from the United Kingdom and a majority from California. One interesting trend we saw in the firms added in 2021 is that they all report they optimize for impact as well as financial returns. None indicate a sole focus on returns. Additionally, they all report having similarly diverse focus areas across Food and Agriculture, Industrials, Information Technology, and Energy.
Firm Creation
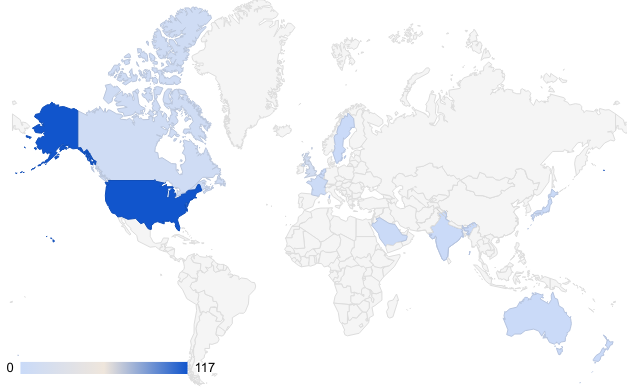
Western-Weighted Geographic Coverage
The majority of the firms in our Capital Index are headquartered in the US (75%). We have representation from 14 other countries as well – mainly from Europe (15%) and Canada (6%). While additions to the Index have increased representation from Oceana, our data coverage is clearly biased toward our greater familiarity with capital market players in the US and Europe. We are committed to expanding our research to other important global regions and welcome the help of our Network and partners to bring data about investment activities in these areas to our attention. You can access the form to nominate a capital provider for our Capital Index here.
Investment Analysis
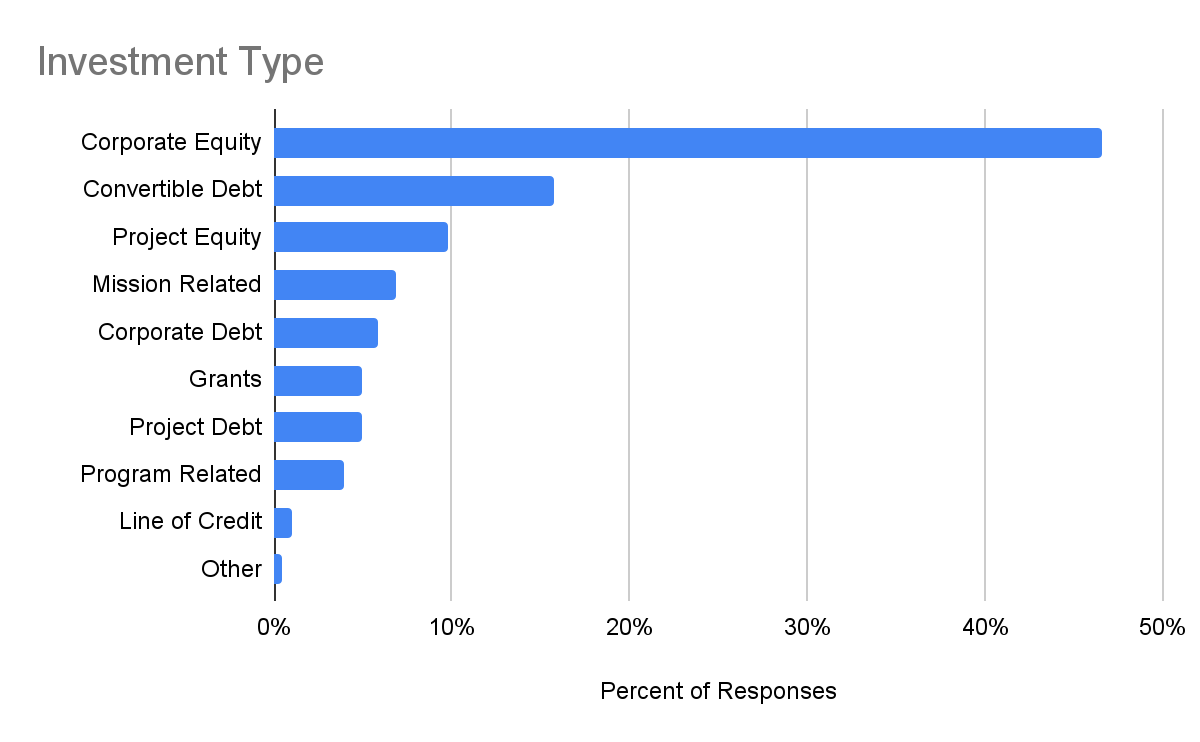
Increase in Corporate Equity Focused on the Sector
Firms are deploying a broad range of investments into the Circular Carbon sector. Corporate Equity is the most common type of investment, followed by Convertible Debt, which reflects the dominance of Venture and Private Equity firms in our Index. In fact, Corporate Equity increased by 46% from 2020, perhaps reflecting the growing rush of equity capital into earlier-stage Circular Carbon solutions that are coming to market.
There are also a meaningful number of firms now making Project Equity and Project Debt investments (22 combined) and an even larger number (32) making Mission Related Investments (MRI’s), Program Related Investments (PRI’s) and grants, representing the fact that we have a good number of Foundations and Family Offices with philanthropy vehicles in the Index.
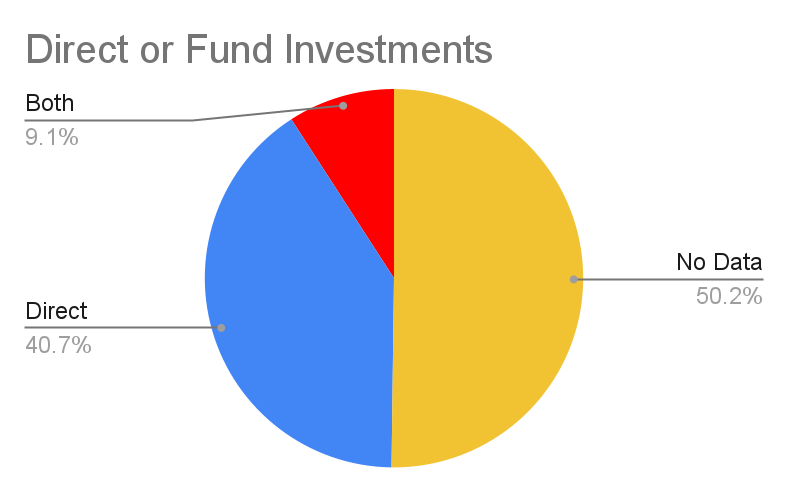
Focus on Directs with Modest Growth of Interest in Funds
The majority of firms in the Index make direct investment only (investments directly into companies versus into funds), however 23 firms say they also consider and make investments into funds. This is a slight increase from the 2020 report data, indicating a continued and growing interest in capitalizing additional Circular Carbon funds.
Investor Descriptions
Carbon America
Carbon America is a vertically integrated carbon capture and sequestration super developer. We are financing, developing, and executing CCS projects with technology of others while developing much lower cost technologies ourselves.
Activate Capital
Activate Capital is a leading venture capital and growth equity partner to companies building smart, sustainable systems across the energy, transportation, and industrial technology markets. The firm aims to generate best-in-class financial returns while contributing to this vision of the future by investing in entrepreneurial management teams in high growth companies using technology to make the world more efficient, intelligent, and sustainable.
Galvanize
Galvanize Climate Solutions is a mission-driven investment platform that will provide capital, expertise and partnerships necessary to produce and scale vital and urgent climate solutions. Tom Steyer has co-founded Galvanize with Katie Hall
Just Climate
Just Climate, an investment business dedicated to climate-led investing, founded on the belief that, such is the scale and urgency of the climate crisis, capital going into climate solutions must now go deeper and broader.
Earthshot
We invest in both hardware and software companies from Seed through Series B across energy, mobility, food & agriculture, industry, and carbon. We help supercharge our portfolio companies’ growth by plugging them into our global network of customers, investors, and policymakers. We bring unique insight blending venture funding with other forms of capital, such as project finance, to help companies scale.
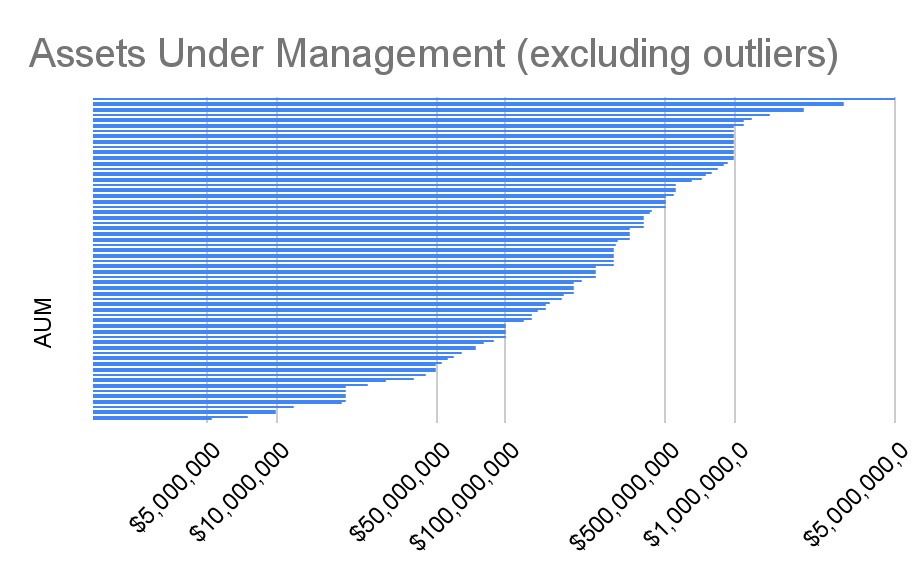
Circular Carbon Focused AUM Continues to Increase
The firms in the Capital Index are currently managing over $201 billion. This is heavily influenced by two large institutions, TPG and Generation Investment Management with $108B and $36B under management respectively. However, it is worth noting that both of these firms launched new climate-specific funds this past year (the TPG Rise Climate Fund with $5.4B AUM, and Just Climate with an AUM reported to be at least $1B). The remaining investors manage a total of $58B between them. Excluding the outliers, the average AUM is $544MM, while the median is $300M. The largest investor manages $6 billion and the smallest $1.3 million.
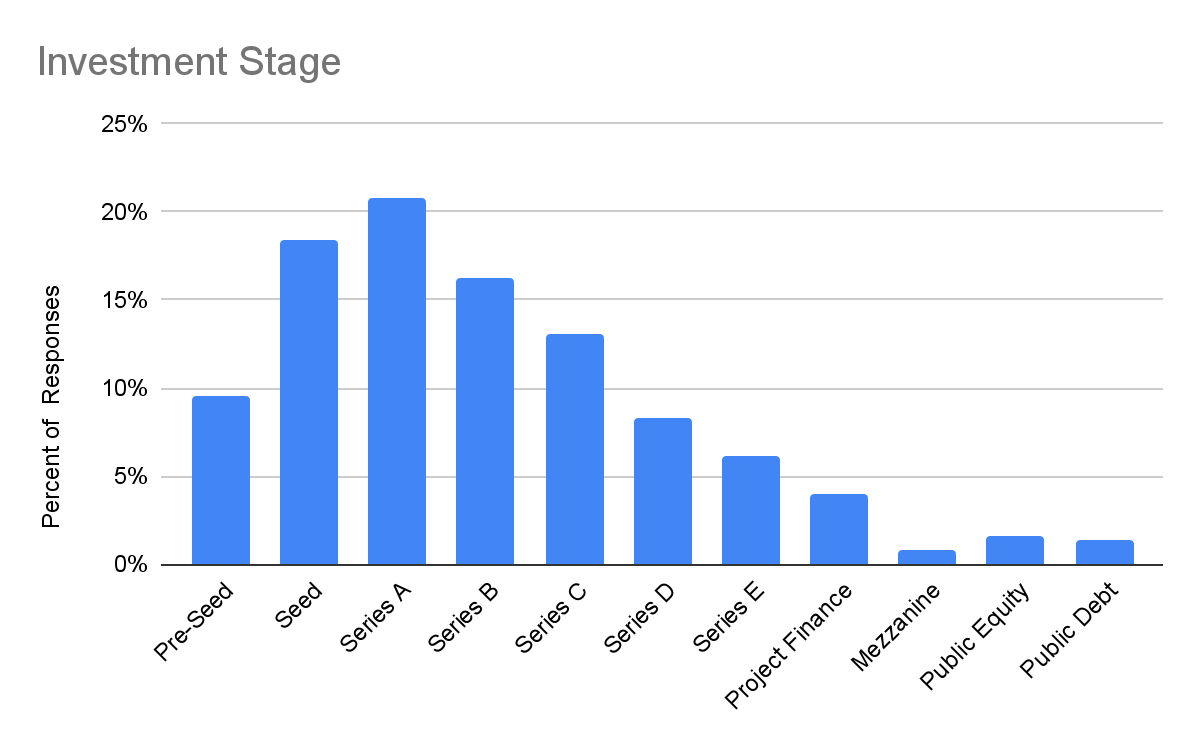
Diverse Stage Focus – Early to Growth
Investors are deploying capital across many investment stages, from pre-seed to project finance. There is a near equal balance between those looking to deploy in earlier stages (Pre-Seed 10%, Seed 18%, Series A 21%) and later stages (Series B+ 51%). In contrast, a smaller percentage are looking for Project Finance, Mezzanine, Public Equity or Public Debt investments (8% total).
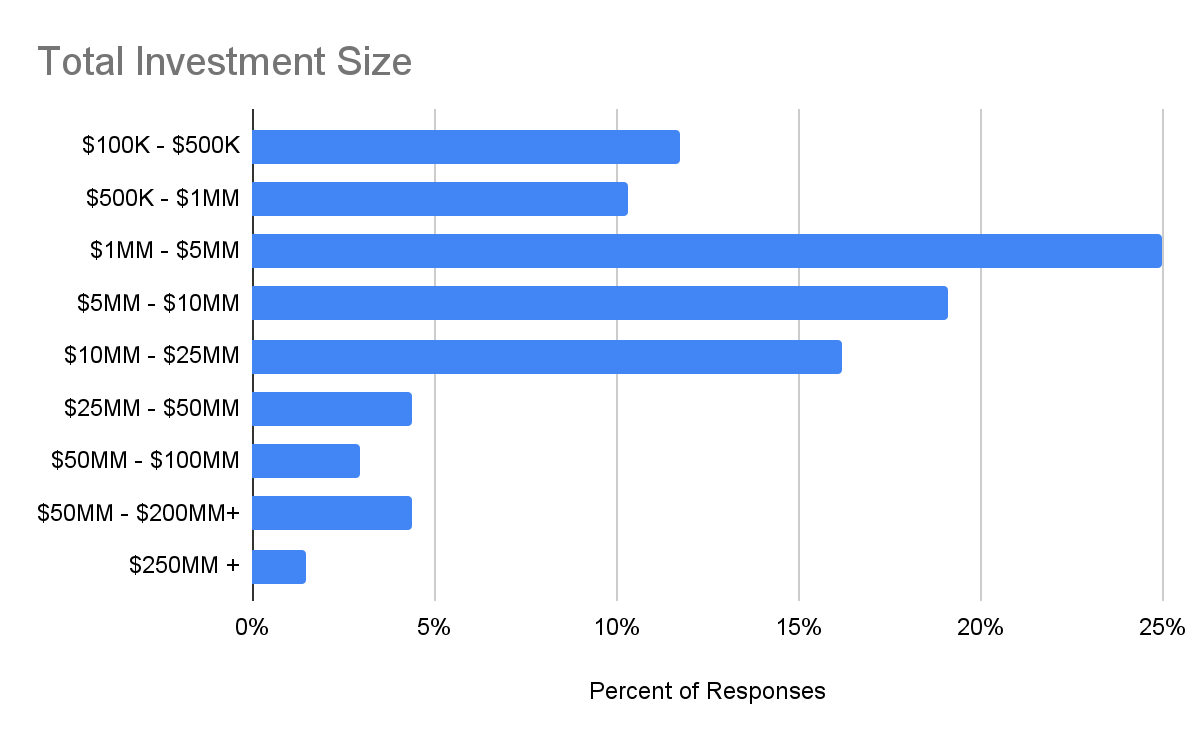
Increase in Target Check Sizes
The majority of investors in the Index reported being able to deploy an initial investment of $1MM or more into a single company, while 29% are looking to invest $10MM or more. Compared to 2020, there are signs of movement towards slightly larger investments, with investment ranges of between $1MM to 25MM now being the most common stated targets. As the sector continues to mature, we hope to identify more capital providers who are interested or moving into the Circular Carbon space.
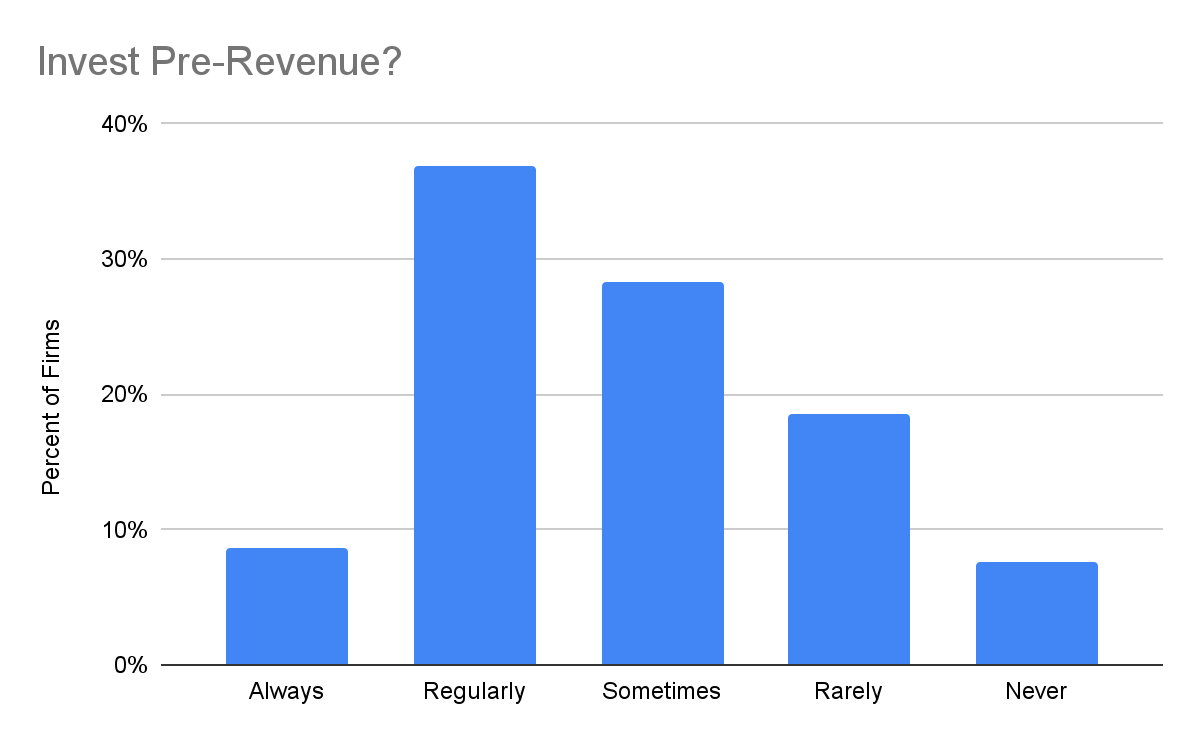
Increased Openness to Pre-Revenue Companies
Nearly three-quarters of firms (68) indicate that they always, regularly or sometimes invest in pre-revenue companies, an increase from last year’s data. This indicates a willingness to take on early-market investment risk, which is likely needed if we are going to finance and grow the Circular Carbon solutions needed in the increasingly tight timeframe we have.
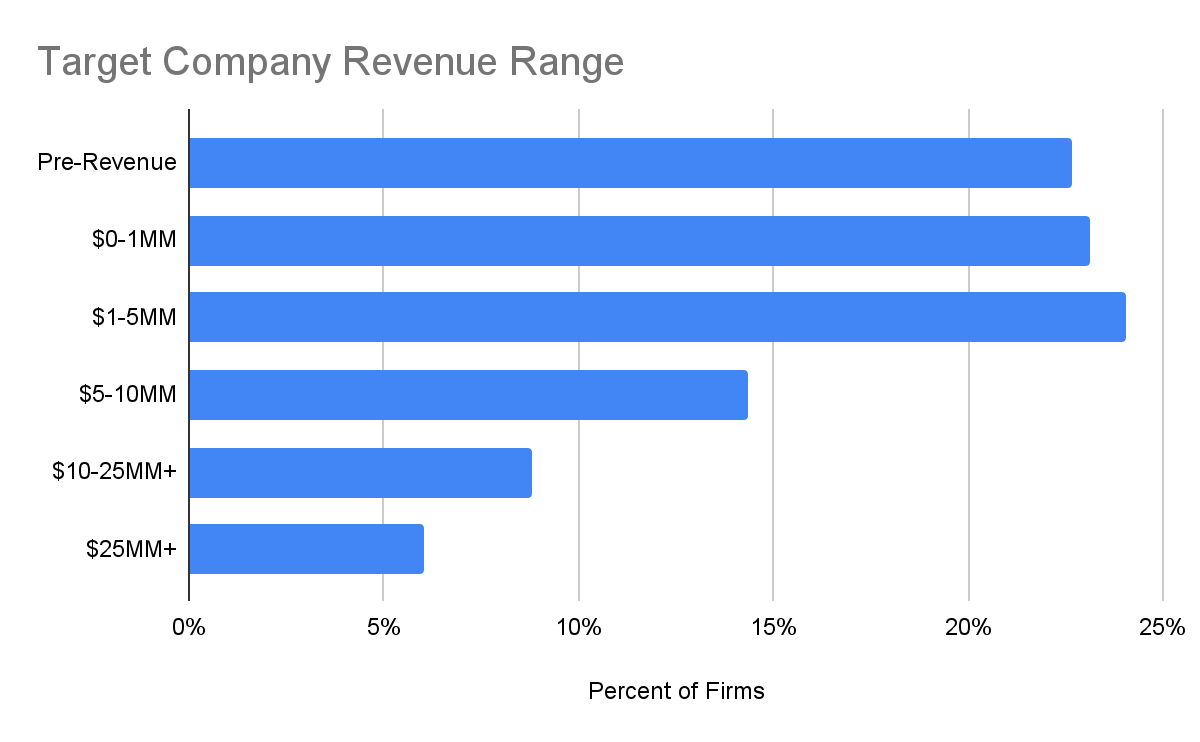
Continued Interest in Early-Stage, Increased Interest in Growth-Stage
Most capital providers in the Index (70%) are targeting companies in their early commercial stages (pre-revenue through $5MM of revenue). While there is continued interest in these early-stage companies, there is also a growing focus amongst investors in the Index on companies with meaningful revenue traction. 67 firms, or roughly a third, indicate they are looking for companies with over $5MM in revenue. This may reflect the beginnings of maturation in the Circular Carbon capital ecosystem as expectations for commercial traction increase.
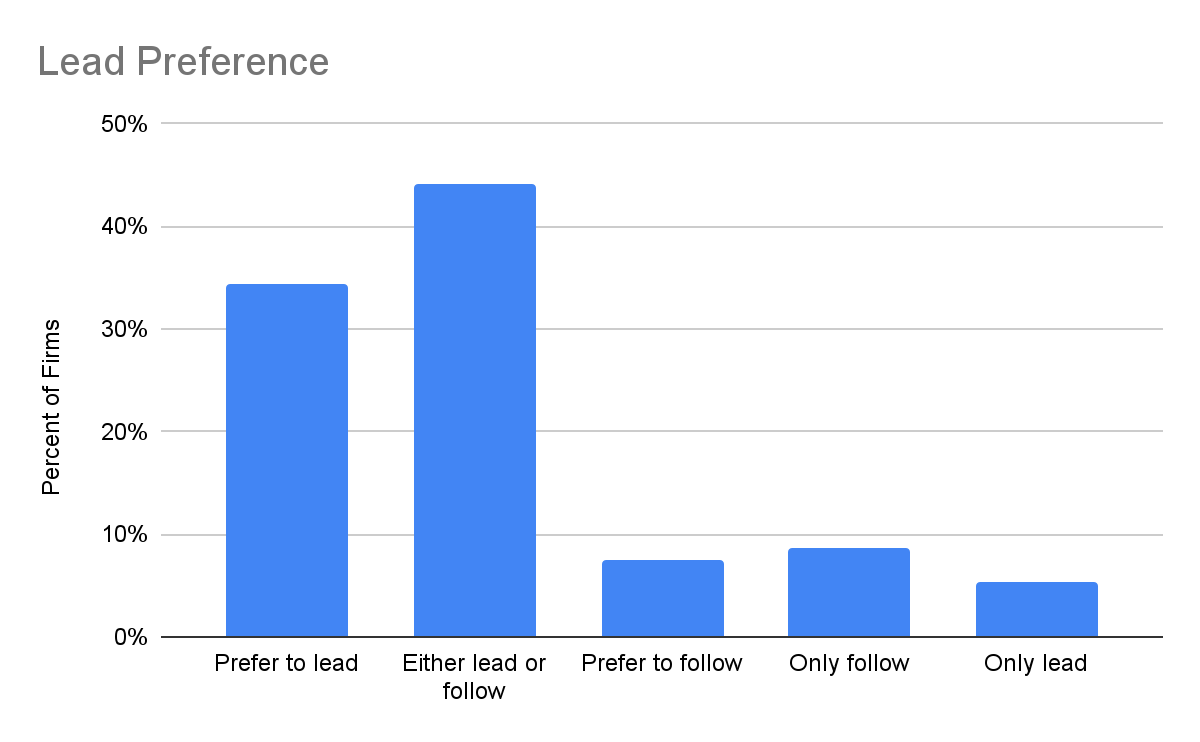
Robust Pool of Leaders and Followers
Most investors (44%) will either lead or follow, with no stated preference between the two. Roughly a third prefer to lead, a reduced number from 2020. Only a small number indicate a preference for following. It is encouraging to see both types of investors in the market, given that it is unlikely all investors in the Index have built the technical due diligence capabilities that evaluating Circular Carbon opportunities often requires.
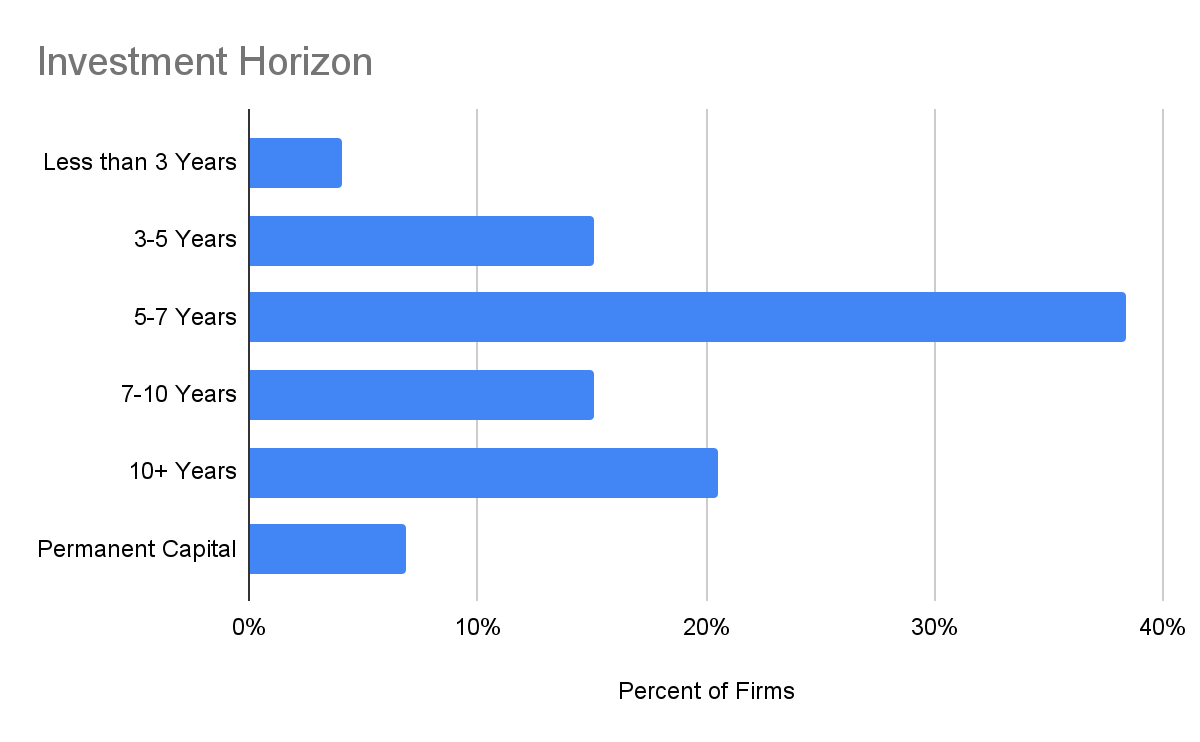
Notable Increase in Patient Capital
The majority of investors indicate a typical horizon of between 3-7 years. However, we are also tracking a 150% increase in patient capital (7+ year horizon) from 2020, a good indicator that more investors are comfortable with the longer technology and market development times that are likely required for the maturation of the emerging Circular Carbon economy. A small number (5 firms) are also working with permanent capital. The Circular Carbon economy, like other impact investing themes that require evolutionary change in large human systems, needs time to mature, but it also needs capital. This positive trend towards more patient capital is encouraging.
Impact and Returns
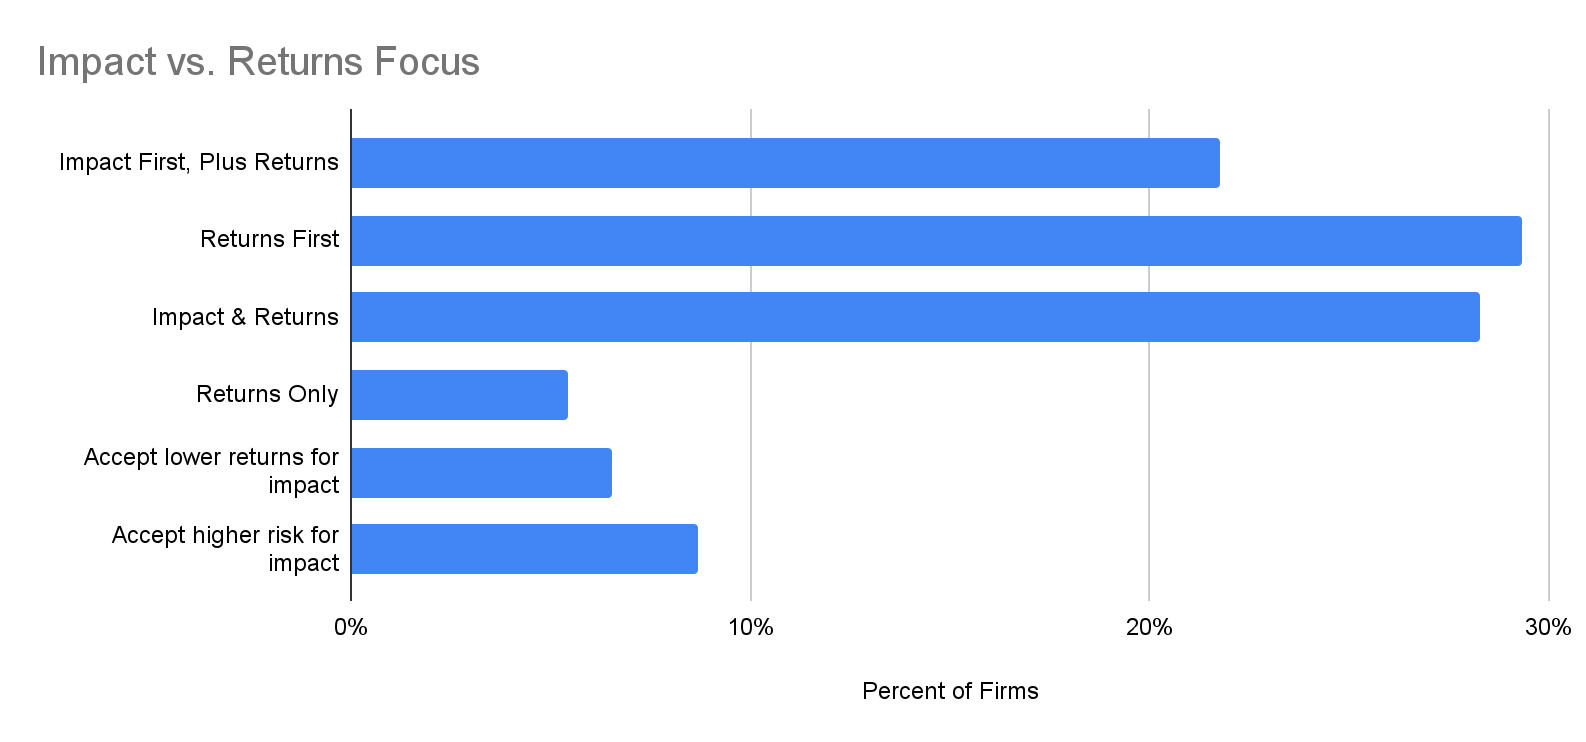
Increase in Impact Focus, Decrease in Returns-Only Focus
Circular Carbon is a leading sector that represents a shift in the investment thesis from returns only focus to investing for a positive impact on issues of concern. The expressed preference of the investors in our Index reflect this, with a large number stating that impact and returns are equal factors in their investment decision making (28%). In fact, the number of firms reporting “Returns Only” as their only focus decreased by 6% in 2021 from 2020 and represents the smallest portion of investors. Additionally, an increasing number stated they are willing to accept lower returns or higher risk for impact, representing 15% of the firms in our Index. These results suggest that the shift towards integrating impact into investment decisions is here to stay. In a sector with the potential for high performance in both returns and impact, this is good news.
Impact Focus Highlights
“Climate change is the single biggest existential threat to society, but also a massive opportunity. We believe that investing venture capital for carbon and waste reduction will yield important impact and financial returns.”
“Our investments support companies forging a bold path to a regenerative economy – one in which the end condition is better than the original state. We back businesses that develop people and global capacity while respecting natural resources and restoring – not depleting – the environment.”
“All ventures must have the potential for high growth and to reduce carbon emissions by 10 million tonnes.”
“We take into consideration the ESG impact of every investment we evaluate – looking at business fundamentals to assess a company’s environmental impact, as well as relevant quantified metrics, where applicable/available.”
“Galvanize will help lead the effort to close the climate investment gap by spearheading the use of Movement Capitalism – an economic philosophy that employs the foundations of capitalism – innovation, entrepreneurship, competition – and merges those with the power of global activism, in support of a higher public purpose. The practice of Movement Capitalism involves not only generating profit, but also successfully addressing global challenges, such as the climate crisis.”
“We seek to harness the power of institutional capital to accelerate, and to set a new standard for, climate-led investing. We define climate-led investing as an investment approach that seeks to catalyze timely climate impact at scale, while seeking to deliver appropriate risk-adjusted returns. Our ambition is to identify and invest in high impact solutions for climate mitigation, as well as to catalyze and multiply capital to scale them.”
“We built Earthshot Ventures to invest in bold and diverse founders who are building the most important, impactful, and profitable new companies to address the climate crisis.”
Focus Areas
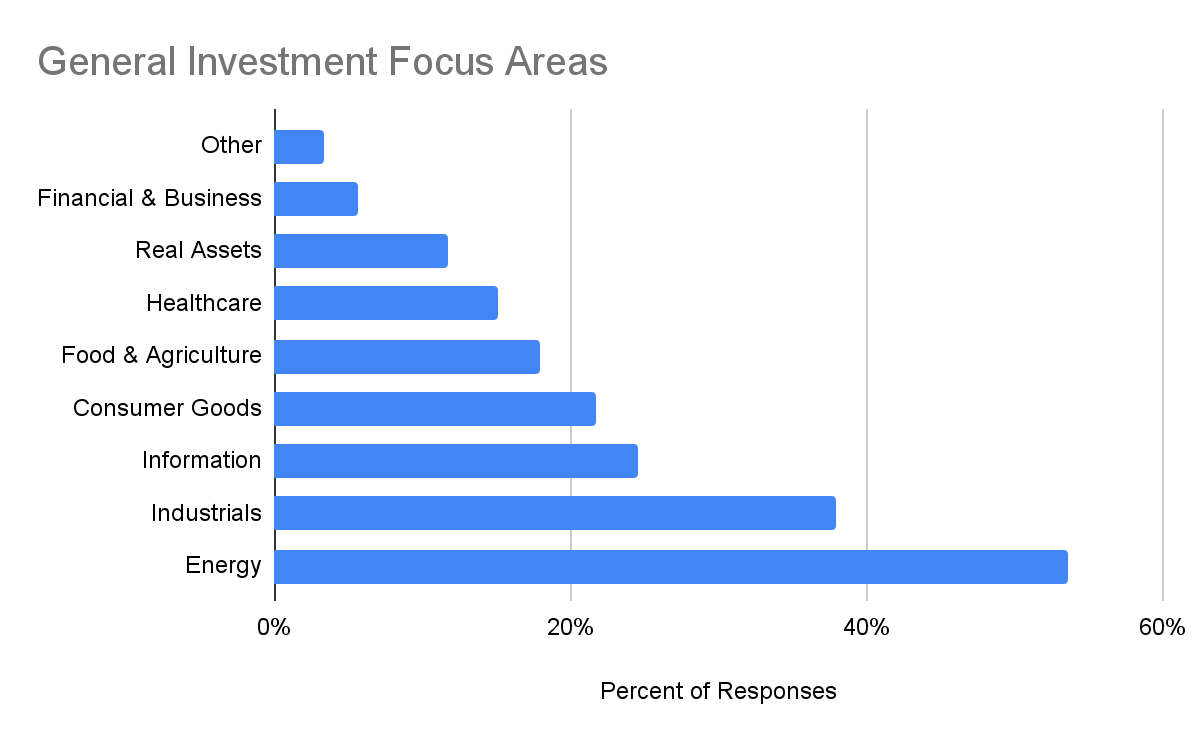
Diverse Macro Focus Areas, with Growth in IT and Food & Ag
While we see a wide range of investment focus areas representing a diverse spectrum of industries, Energy and Industrials are the most dominant. We saw a noticeable increase in firms generally focused on information technology from 2020 to 2021 (from 12% to 24%), perhaps indicating both the growing relevance of Circular Carbon opportunities to conventional silicon valley-type firms as well as the rise of IT-related Circular Carbon solutions (such as marketplaces and other enabling, software based solutions).
Additionally, as broadened our lens to include investors interested in Carbon Removal (not just Carbontech) in the Index this year, we found that Food & Agriculture emerged as a focus area for 18% of the investors now in the Index.
All Cleantech-Interested Index
Our search for capital providers continues to be focused on those firms that are already active or interested in the broader cleantech sector. Unsurprisingly then, cleantech is a core focus, the core focus, or something that 100% of the investors represented in our Index consider.
Clean Technology
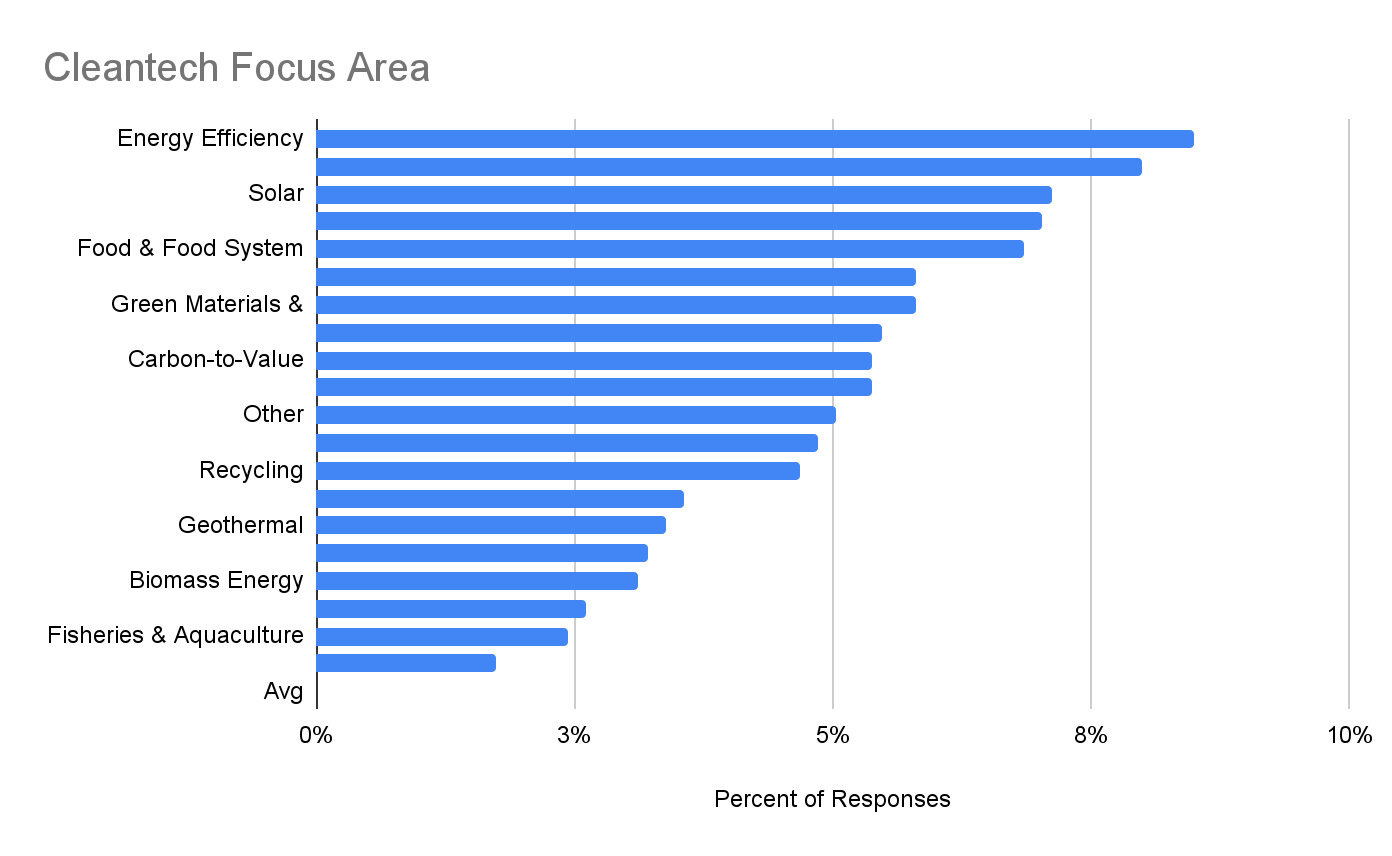
Diverse Cleantech Focus Areas, with Notable Increased Focus on Circular Carbon
There is a broad range of clean technology sectors that investors in the Index are focused on, with most selecting at least 6 sectors of investment. Energy-focused sectors are at the top of the list, such as energy efficiency, energy storage, solar and mobility. Encouragingly, we saw a ~33% increase of interest in carbon-related sectors (Carbon Removal, Carbon-to-Value, Carbon Capture) since last year.
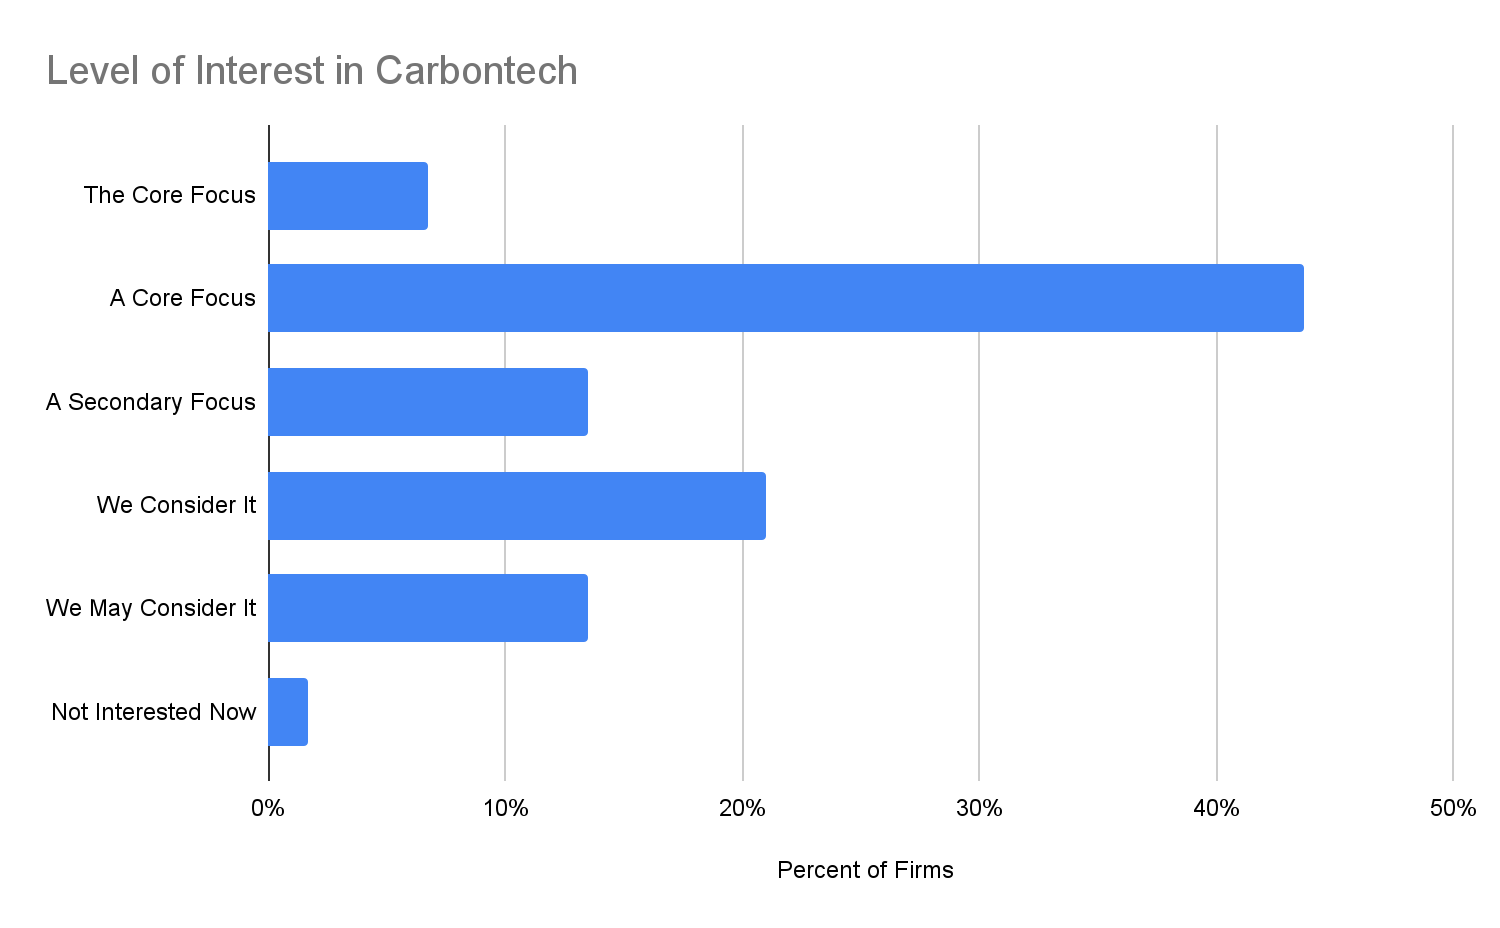
Significantly Increased Interest in Carbontech
Carbontech — defined as technology-enabled means of capturing, utilizing, and/or storing CO2 — is an increasing focus of investors in our Index. Currently, 74% of all capital providers consider Carbontech investment opportunities. This is up by almost 20% points from last year. These carbon-curious investors represent $177 billion of total assets under management.
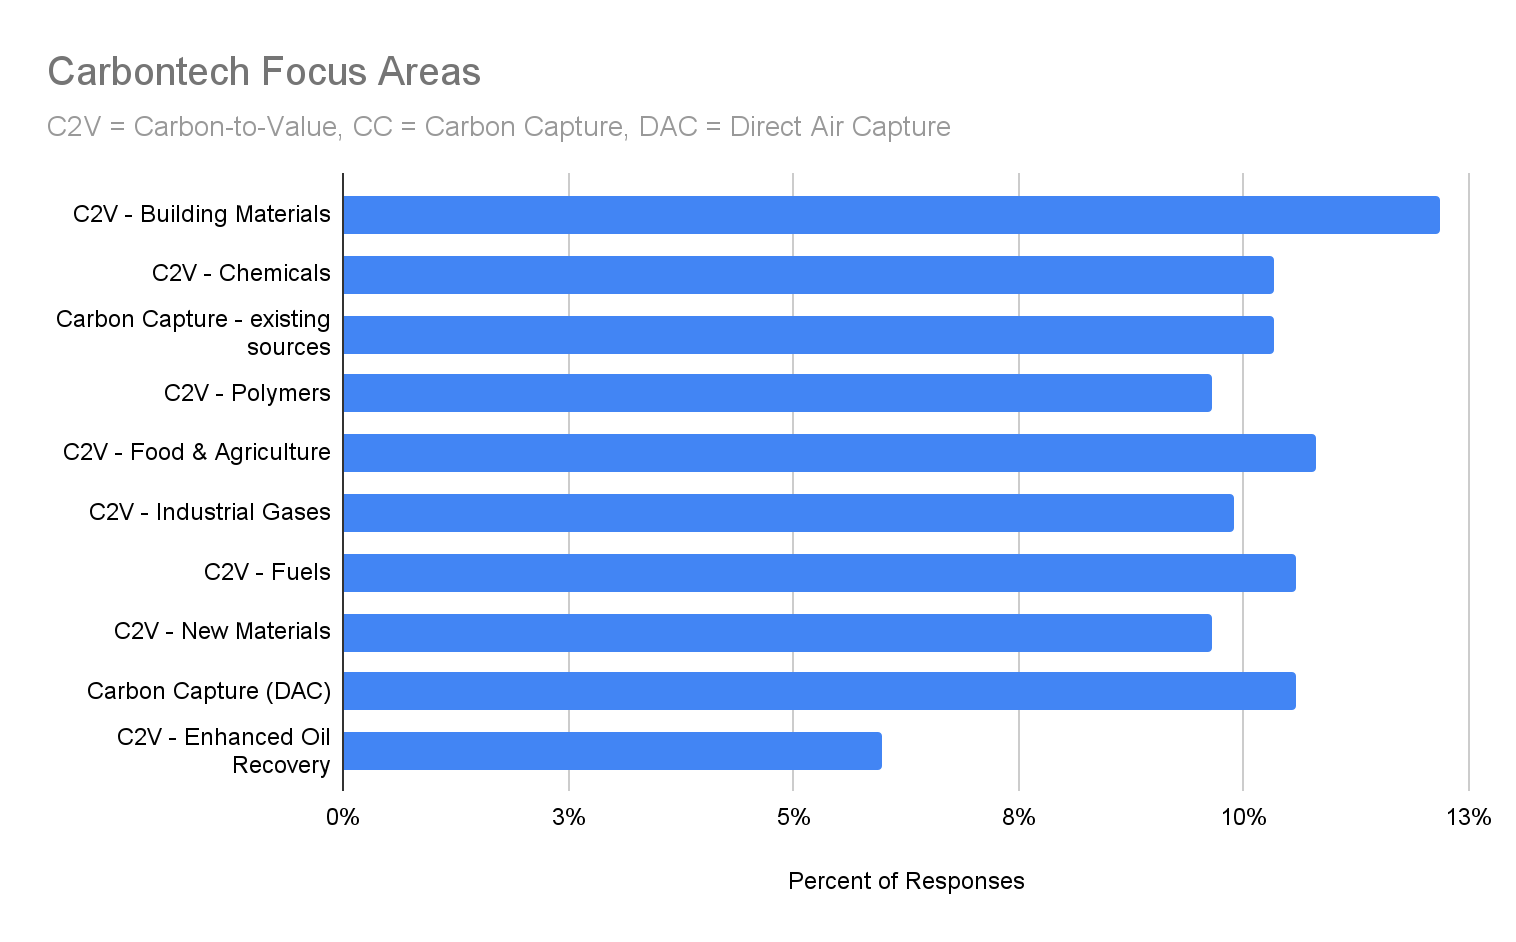
DAC Up, EOR Down
Zooming in on the pathways in Carbontech that investors are focused on deploying capital to, there is a fairly even spread of interest in all the well-known pathways. Two outliers are a lower general interest in carbon-to-enhanced-oil-recovery (EOR) and a higher general interest in Direct Air Capture (DAC). The low level of interest in EOR is somewhat surprising, considering that it has long been considered an attractive, existing entry market for carbon capture companies to exploit. On the other hand, the recent Covid-driven drop in global oil markets has likely reduced those opportunities. On top of that, EOR has a controversial profile amongst some audiences, especially environmental advocates, who view it as counter-productive to capture carbon to produce more fossil carbon. It is possible that this decrease is being replaced by an increased interest in DAC, where we saw a 50% increase from 2020.
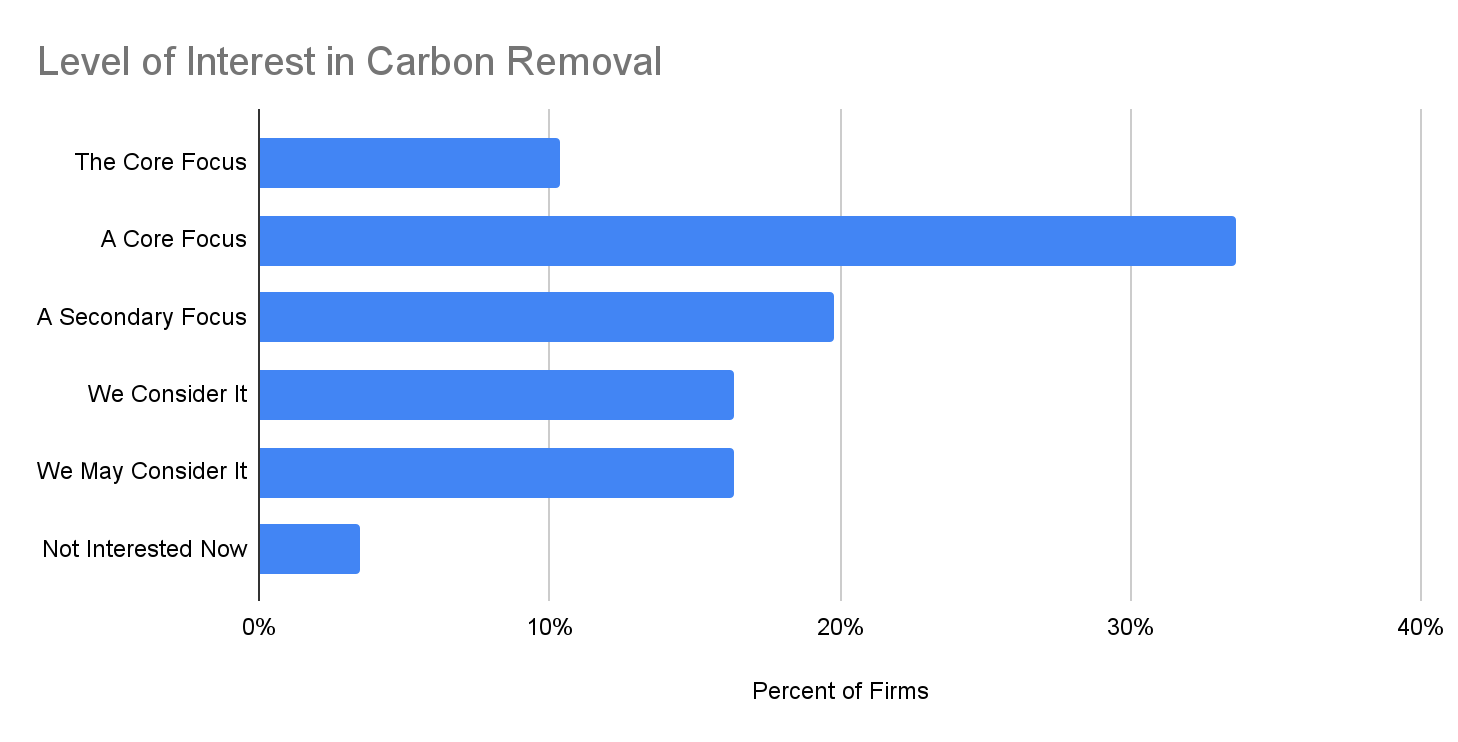
Interest in Carbon Removal Significantly Up
The majority of firms in our index report that Carbon Removal is a core focus, secondary focus, or something they are considering. The number of firms with a core focus on Carbon Removal increased by 16 to 34% of responding firms, an encouraging increase over the last 12 months. These carbon removal-interested investors represent $177 billion of total assets under management, 88% of the AUM in the Index
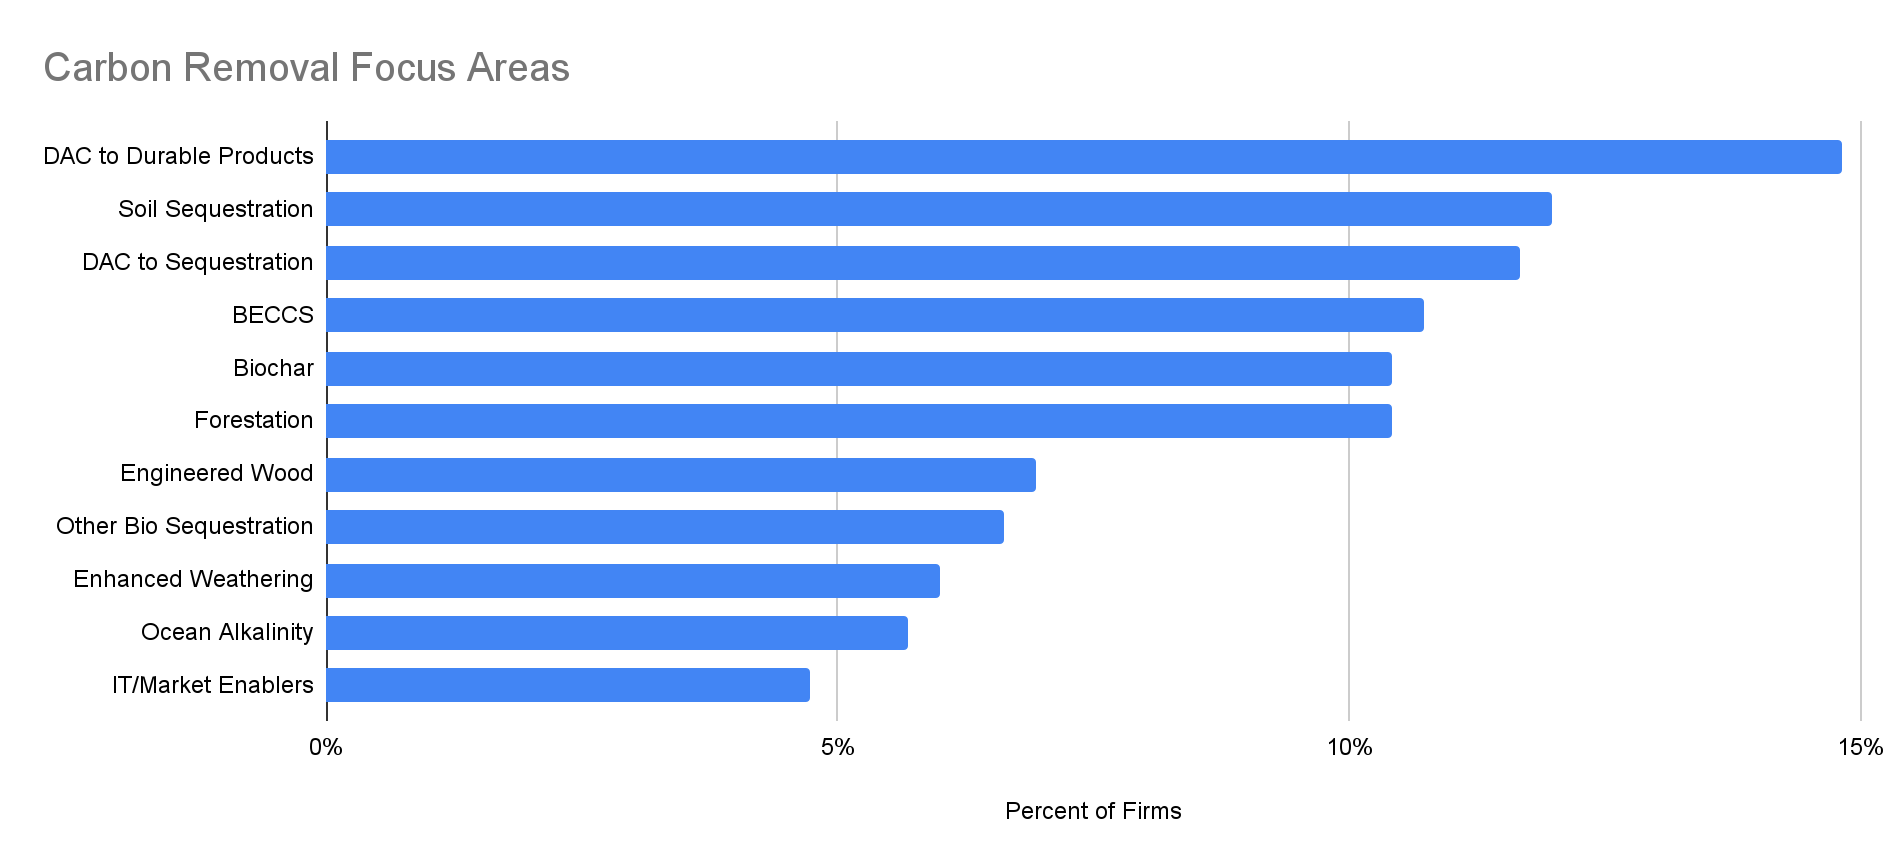
DAC On Top Again, But Other Pathways Expanding
Direct-Air-Capture-to-Durable-Products continues to lead the list of focus areas in Carbon Removal that investors are pursuing, followed by Soil Sequestration, Direct-Air-Capture-to-Long-Term-Geologic-Sequestration, BECCS, Biochar and Forestation. There is a continued increase in interest in DAC as both existing solutions continue to mature and new solutions emerge. That said, it is worth noting again that our overall data set is still likely influenced by our original, NRG-COSIA-Carbon-XPRIZE-focus on Carbontech.
In contrast, investor interest in BECCs has appeared to drop, perhaps due to the increasing scrutiny around related land-use issues. There is also a rise of interest in IT-related solutions and Market Enablers, which is consistent with the continued maturation of this sector and the mainstream IT-experienced investors it is attracting.
It is also worth noting here that the “Other” category is quite large, indicating the explosion of interest and innovation in the Carbon Removal field. We will work to continue updating our Index to capture and better categorize the growing diversity of solutions.
Capital Deployed
Significant Increase in Tracked Capital Deployed
Our research has identified 80 investments totaling $244MM into Circular Carbon-specific opportunities (both Carbontech and Carbon Removal) by investors within the Capital Index. This is an 87% increase in the value of investments recorded in the Index versus 2020 ($131MM in 2020).
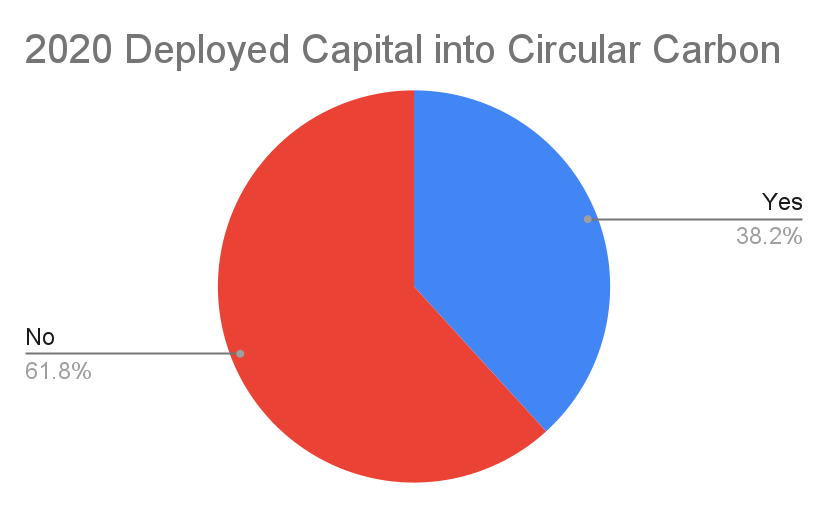
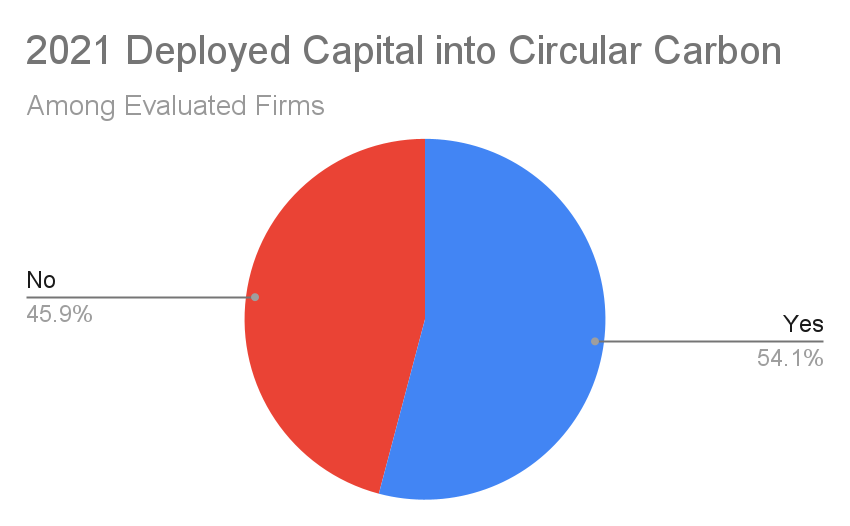
Overall, 29% of the investors in the Index indicated that they have made at least one investment in the space, an increase of 8% from last year. However, of those investors who provided a response to this question, fully 54% had deployed capital into the sector to date. Given the limited response to the capital-deployed question and the clear evidence of new firms and increased AUM focused on the sector, we are likely significantly under-counting the percentage of investors on the Index who have in fact deployed capital into the sector.
Based on the data we have, the average deal size was just over $3MM, while the median was $500,000. These numbers are somewhat skewed by the large number of <$1MM of R&D-focused investments from the Emissions Reduction Alberta fund, which deployed 48 out of the 64 investments new to the index in 2021.
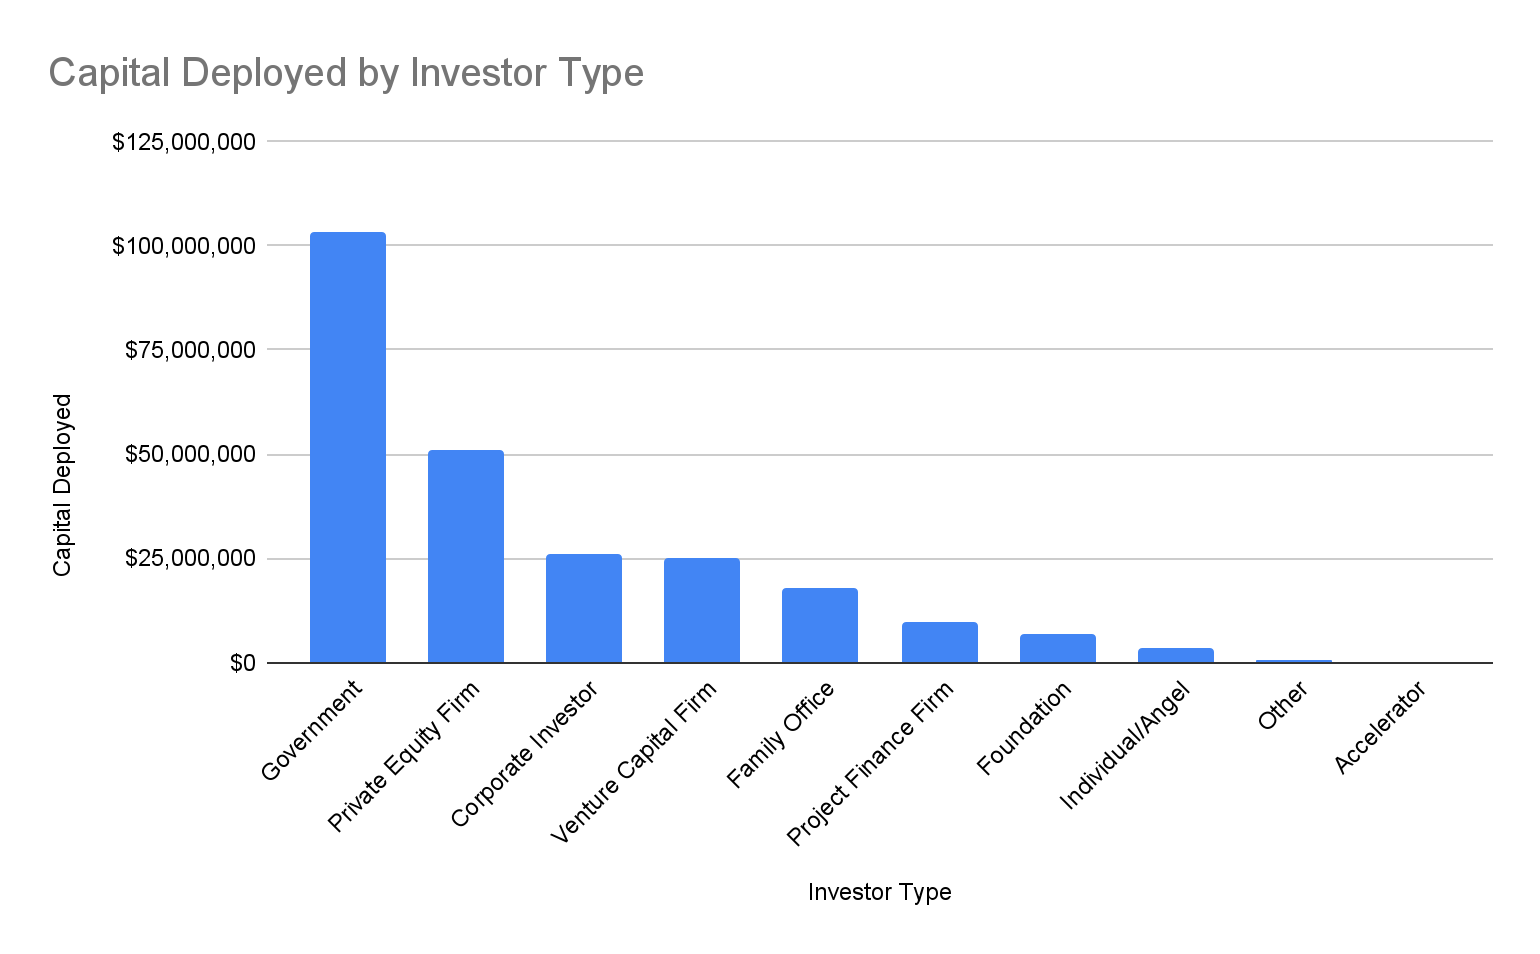
Government and Institutional Investors Top Tracked Capital Deployers
This year we added Project Finance Firms, Accelerators, and Government as Capital Provider categories in the Index. Together, these categories accounted for $113MM of new funding in 2021 (Government accounted for $103MM of that). Private Equity ($51MM), Corporate Investment ($26MM), and Venture Capital ($25MM) are the other leading investor types who have recently deployed capital.
We were somewhat surprised by the low level of capital sourced from Family Offices and Angels, though given the privacy-preferences of those investor types, the Index is almost certainly under-counting the amount of capital they have deployed into the sector.
Similarly, given the total amounts raised by startups in our Innovator Index (approximately $3B to date) and the new investment opportunities we tracked in our Deal Hub in 2021 ($816MM), we are also certainly under-counting the total amounts deployed by investors in the Capital Index overall.
Notable Investments
Carbon Removal Marketplaces:
Nasdaq – Puro.earth
Direct Air Capture:
Aera VC – Noya
Carbon-to-Chemicals:
Capricorn Investment Group – Twelve
Carbon-to-Advanced Materials:
Cantos Ventures – Visolis
Soil Carbon Removal:
Lowercarbon Capital – Loam Bio
Carbon-to-Polymers:
ArcelorMittal – LanzaTech
Carbon-to-Fuels:
Cemex Ventures – Synhelion
CALL TO ACTION
-
Use Capital Index
-
Nominate organizations to add to the Capital Index
-
Update data in the Capital Index
-
Join our Network
-
Contact us, if there is something else we can help you with
CORPORATE LANDSCAPE
Overview
About the Index
As some of the world’s largest emitters of CO2, large corporations have a huge role to play in the transition to a Circular Carbon economy. Beyond complying with evolving regulatory requirements and reducing climate-related business risk, these companies also have much to gain in the form of new revenue streams, new innovations, brand enhancement, and other strategic benefits.
The purpose of CCN’s Corporate Index is to identify, measure, and characterize corporate activity that meaningfully intersects with the Circular Carbon sector. Our goal is to both better inform the marketplace about these activities as well as facilitate more efficient collaborations between corporates and technology innovators, investors, and other key societal actors critical to the growth of the Circular Carbon economy.
In that vein, a corporation must have at least one concrete intersection point with the sector to be included in the Index (specifically, Circular Carbon-related R&D, Investment, Project Hosting, Purchasing, Sales, or other material intersections). Our research team gathered this information through a review of publicly available information. In all likelihood, our Index under-represents the level of corporate activity in the Circular Carbon sector globally. We welcome nominations [link] and updates [link] to the Corporate Index to continue to improve its usefulness and accuracy.
Data Snapshot
80
Number of corporates
19
Industry Verticals
21
Countries
6.3 Billion Tonnes
CO2 Emissions
$5.43 Trillion
Revenues
7.45 Million
Employees
BCG has committed to reach net-zero climate impact by 2030 and then to become climate positive—removing more carbon from the atmosphere than we emit each year. To achieve net-zero climate impact, we will transition to 100% carbon removal solutions by 2030, including both nature-based and engineered solutions.
Who’s in the Index?
AIRLINES
FedEx
United Airlines
COMMUNICATIONS
Shopify
CONSUMER DISCRETIONARY
Amazon
BMW
Delta
Interface
Mercedes-Benz
Nike
Porsche
Ralph Lauren
Starbucks
Stripe
Virgin Management
CONSUMER STAPLES
Coca Cola
Danone
Mitsubishi Heavy Industries
Natura & Co
Unilever
Volkswagen
Walmart
Ikea
ENERGY
Baker Hughes
BP
Canadian Natural Resources Limited (CNRL)
Cenovus
Chevron
CNOOC
ConocoPhillips
Drax Group Pic
Equinor
ExxonMobil
Imperial Oil
Occidental Petroleum (Oxy)
Royal Dutch Shell
Saudi Aramco
Schlumberger Technology Corporation
Suncor
Total
HEALTHCARE
W.L Gore
INDUSTRIALS
Boeing
GE
Johnson Matthey
Mitsui & Co
Moeller – Maersk
Norsk Hydro
Siemens
INSURANCE
SwissRe
MATERIALS
Air Liquide
Air Products
ArcelorMittal
BASF
BHP Billiton
Cemex
Dow
Haldor Topsoe
Heidelberg Cement
Lafarge Holcim
Linde
SABIC
Siam Cement Group
Sumitomo Chemical
OTHER
Boston Consulting Group
Land O’Lakes
Viridor
TECHNOLOGY
Algorand
Cisco
Corning Incorporated
Intuit
Linkedin
Microsoft
Wipro
UTILITIES
Duke Energy Corporation
E. ON SE
ENEL
ENGIE
National Grid
NRG Energy
Orsted
Southern Company
Corporate Index Overview
Carbon-Intensive Industries Still Dominant, But Interest Broadening Across Sectors
Over half of the corporate representatives in our Index are in the Energy (21), Materials (16), and Consumer Discretionary (12) sectors, followed by Technology (9), Utilities (9), Consumer Staples (8), and Industrials (7). Overall, large companies operating in the energy and carbon-intensive industrial sectors are still leading the charge in our Corporate Index, however, we are now also seeing noticeable growth in interest from companies in a broader range of sectors, particularly consumer- and technology-focused companies.
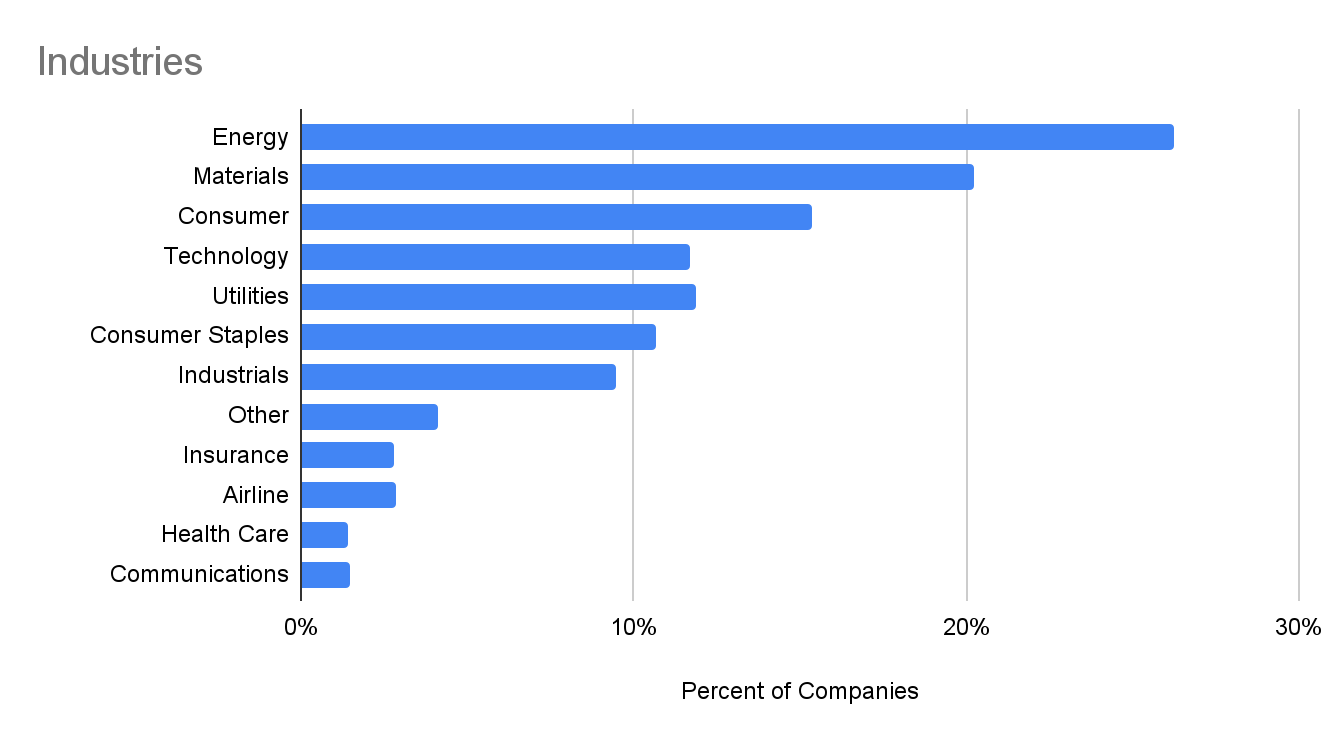
Still Primarily US and Europe Focused
Corporations headquartered in 21 different countries are represented in the Index, with a significant percentage based in North America and Europe. Our corporate coverage parallels our other Indexes with a large percentage of organizations coming from North America, and Europe (particularly US, Canada. UK, Germany, France). As we have stated before, this may be somewhat a product of where significant Circular Carbon activities are currently being generated, but it is also likely a significant reflection of the biases and limitations of our coverage. We are actively seeking to add companies with significant Circular Carbon activities from around the world. You can nominate a large company for the Corporate Index here. [INSERT LINK]
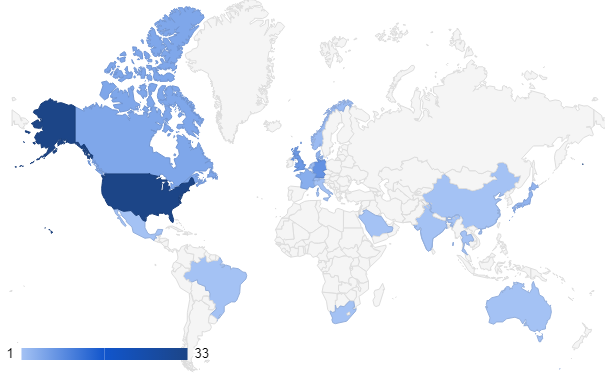
Exploding Corporate Climate Commitments
In 2021, corporate climate commitments grew in frequency, scope, and ambition. Overall, 95% (76/80) of Corporates in our Index have carbon reduction commitments of some form, which is consistent with other reports that over 60% of the largest publicly-traded companies in the world by revenue have documented net-zero targets. Of those with reduction commitments, 17 (21%) have specific Carbon Removal goals this year, as opposed to 6 (10%) last year. Anecdotally, we are also hearing of billions of dollars of corporate purchasing demand for carbon removal credits. All of this is in line with CCN’s 2020 Market Report forecast of growing corporate interest in carbon removal.
For context on our coverage, while it is still a limited cross-section of all corporate activity in the Circular Carbon sector, the companies in our Index already represent 17.24% of all global emissions.
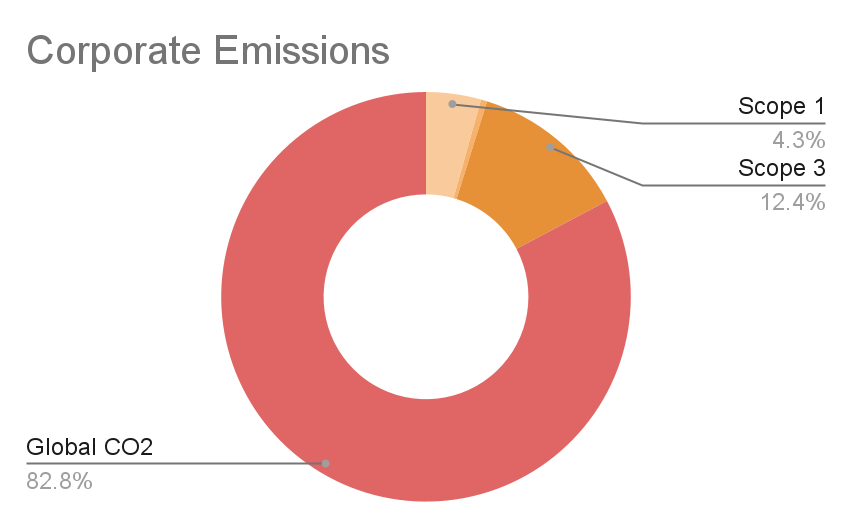
Prominent Circular Carbon Commitments
By placing bets on high-potential, emerging technologies that permanently remove carbon from the atmosphere, we can play a crucial role in fighting climate change.
The science is clear, the challenge is massive: Do our best, remove the rest! In other words: we all need to reduce, reduce, reduce, and in parallel start balancing the unavoidable emissions through carbon removal.
Roles
Corporate Activity Expanding from R&D to Purchasing and Investment
Overall, corporates in our Index are most focused on Circular Carbon-related Research and Development, which is not surprising as the sector itself is still just emerging.
However, companies that were added to the Index in 2021 are more focused on purchasing and investment. Two-thirds of these additions are active in purchasing Circular Carbon solutions, in sharp contrast to 2020, when purchasing was the lowest reported focus area.
Similarly, nearly two-thirds of these new additions are focused on investing in third-party solutions, while less than half are involved in R&D.
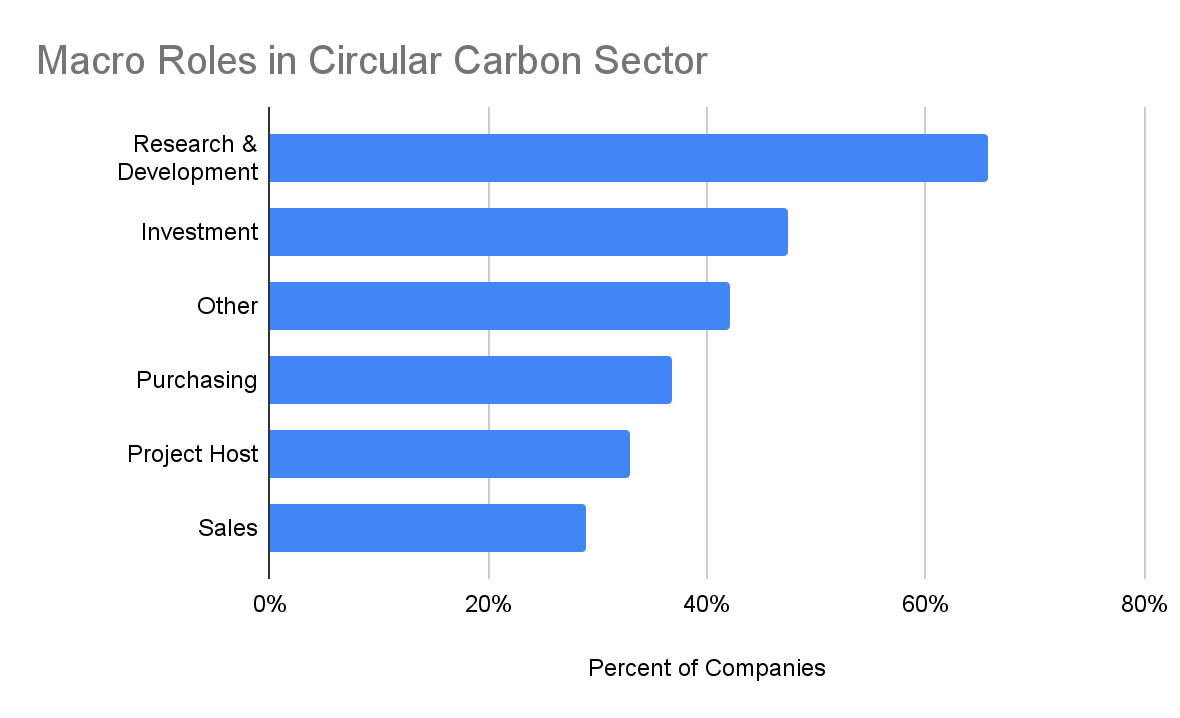
Increasing Corporate Circular Carbon Intersection Points
To track and analyze corporate activity in the Circular Carbon Economy we identified five archetypal roles that large companies typically play in bringing emerging technologies to market:
- Research & Development (internal and/or with third parties)
- Investment (in other companies or projects)
- Purchasing (of CO2, carbon-to-value products, carbontech or carbon removal solutions, or carbon-related offsets)
- Sales (of CO2, carbon-to-value products, carbontech or carbon removal solutions, or carbon-related offsets)
- Project Hosting (hosting of third party solutions on corporate-controlled sites)
We also have a bucket for any “other” material intersection points that fall outside of the classifications above, such as sponsorship of startup accelerators, participation in industry coalitions, and carbon policy initiatives.
Overall, corporates in our Index continue to stay focused on Research and Development, which is not surprising as the Circular Carbon Economy itself is still just emerging. However, corporations that were added to our analysis in 2021 are more focused on investment and purchasing. 2/3 of these additions show a focus on purchasing, as opposed to last year when purchasing was the lowest reported focus area. Additionally, of these new and updated records, 62.5% are focused on investment, while less than half are involved in R&D.
Research and Development
Carbon Capture and Carbon-to-Value Top R&D Focus Areas
Research & Development related to Carbon Capture from Existing Sources remains the most common R&D focus for corporations in the Index. In addition, a majority are focusing on Carbon-to-Value solutions — with CO2-to-Fuels (13%), Enhanced Oil Recovery (8%), CO2-to-Polymers (6%), and CO2-to-Building Materials (6%) taking the lead. As we widened our lens to look for corporate activities relating to Carbon Removal in 2021, we found 15% of the companies in the Index conducting R&D on land-based solutions.
Finally, of note, of the companies focused on R&D, 32% are hosting projects as well.
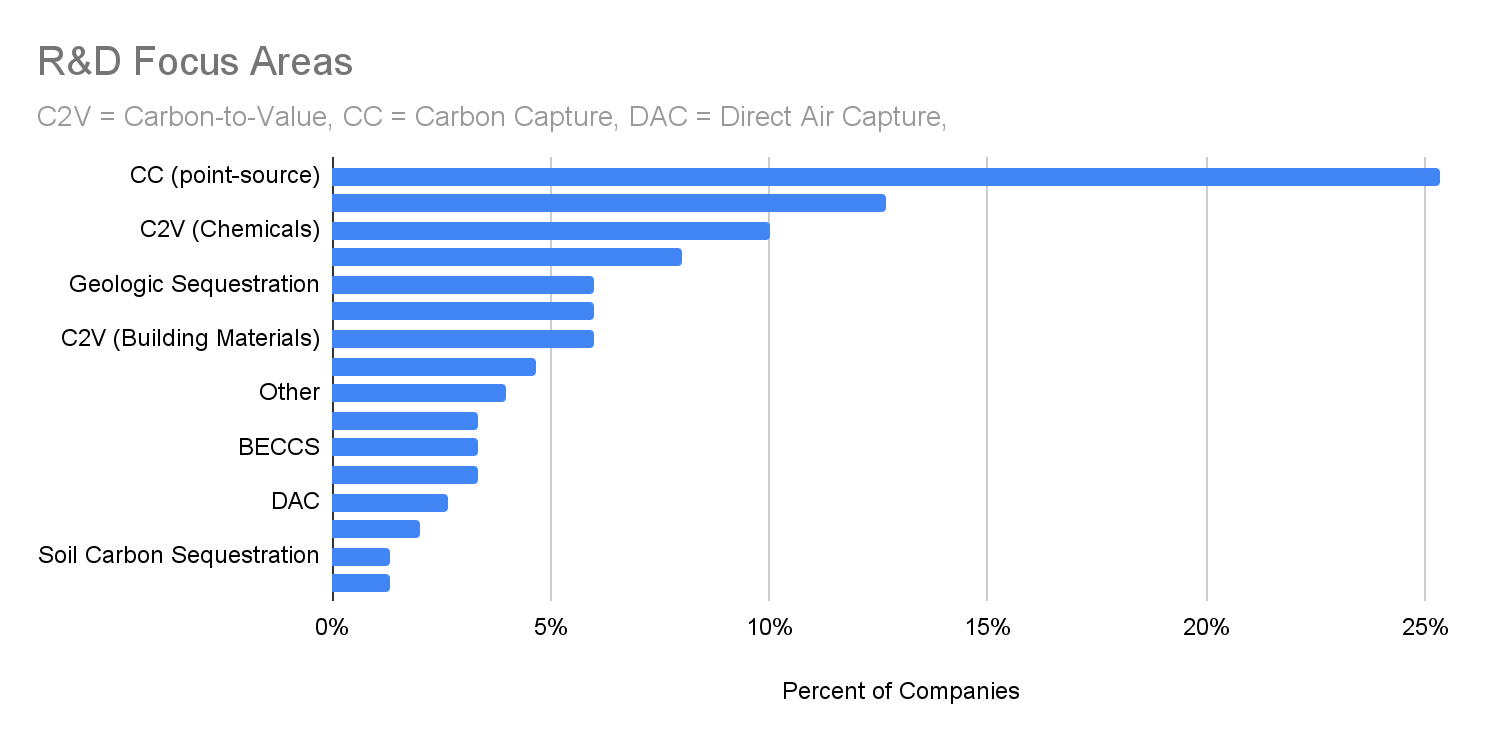
Representative Partnerships
FedEx/Yale:
$100 million to Yale University to help establish the Yale Center for Natural Carbon Capture, accelerating research into methods of carbon sequestration at scale.
BHP + Oldendorff:
BHP, Oldendorff, and GoodFuels are researching the viability of sustainable biofuels in maritime shipping applications.
BP + Exxon + TotalEnergies:
BP, Exxon, and TotalEnergies are sponsors of the U.S. National Carbon Capture Center research facility.
Investment
Significant Increase in Corporate Interest in Carbontech Investments
Carbontech innovators are capturing the attention of an increasing number of corporate investors. Out of 36 corporate cleantech investors, 17 (47%) list carbontech as an investment focus area and 25 (69%) currently consider such investments. 27 corporates are at least considering deploying capital in carbontech, a 42% increase from last year (19). Overall, there is a noticeable increase in the levels of corporate interest in Carbontech.
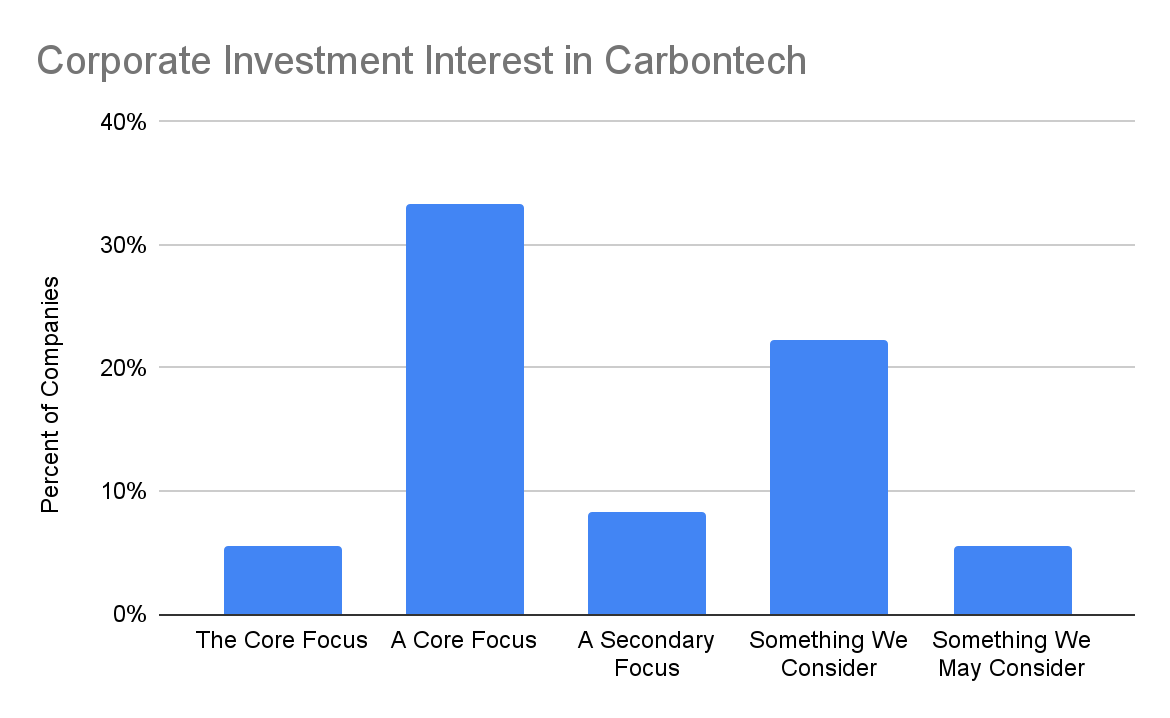
Increased Interest in Carbon-to-Value, Continued Interest in Carbon Capture
Like 2020, the top four corporate Carbontech investment interest areas this year are: (1) Carbon-to-Value Fuels and Chemicals, (2) Point-Source Capture, and (3) Direct Air Carbon Capture (DAC). However, interest in Carbon-to-Value overtook Carbon Capture among the leaders, with Carbon-to-Value Fuels and Chemicals nearly doubling year-over-year in interest.
Notably, Building Materials and New Materials each at least doubled in interest from last year, perhaps indicating growing demand for embodied carbon in buildings and infrastructure.
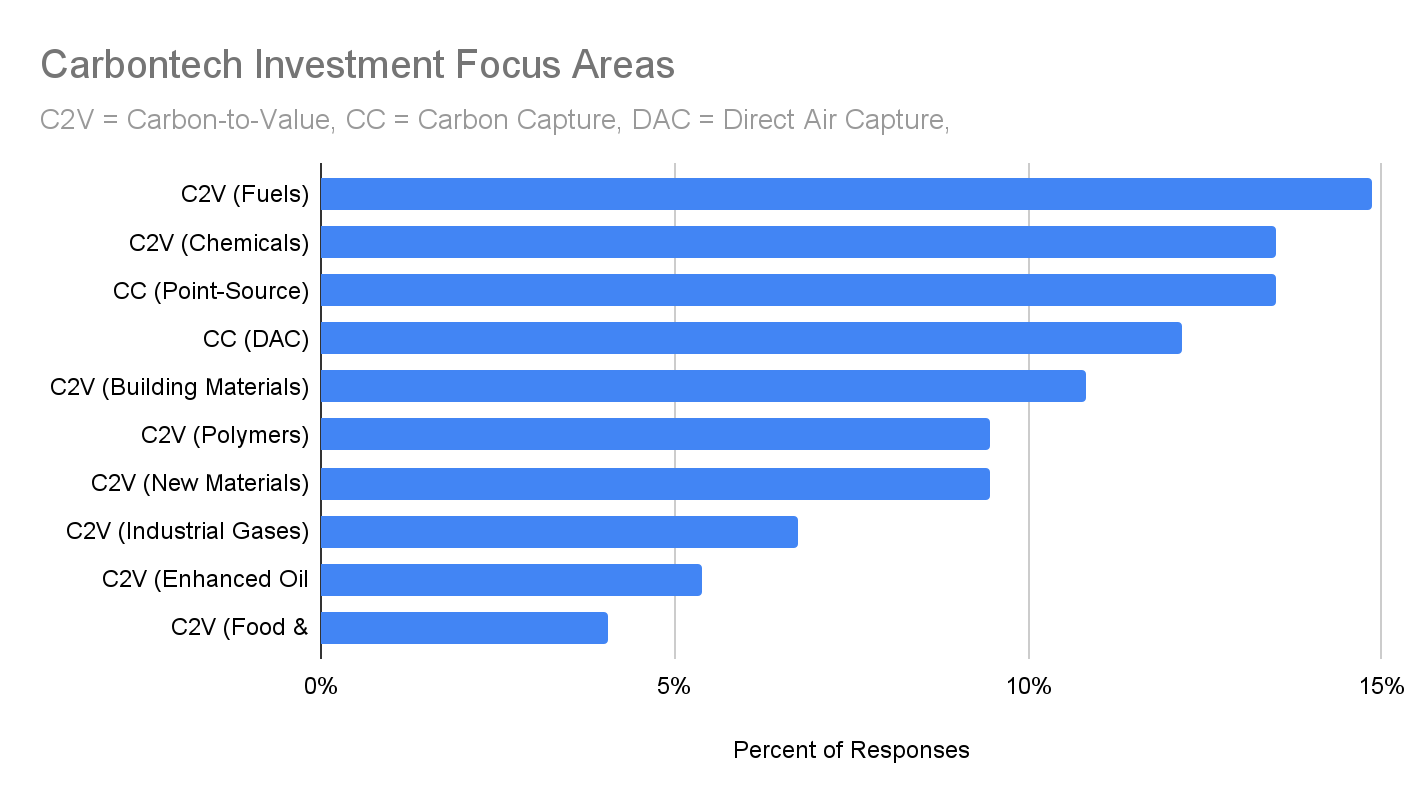
Companies investing in the sector seem to be looking for outcomes that can both be deployed commercially and have a significant, positive climate impact. Some examples of corporate circular carbon investment focus areas in their own words:
BCG
“Through direct investments, Breakthrough Energy Catalyst and its partners (BCG) will help reduce the costs of the clean technologies needed to compete with and replace the greenhouse-gas-emitting counterparts we have today, lowering what are referred to as Green Premiums and ultimately accelerating their widespread adoption.”
Porsche
“70% of all Porsches ever made are still in use, and Porsche sees synthetic fuel [produced from water, wind energy and CO2 captured from the air] as a solution for keeping vintage cars going for decades to come. This is one of the reasons the automaker is investing [20 million euros] in the Haru Oni project”
Mitsui
“Mitsui believes providing low-carbon solutions to hard-to-abate industries such as energy will be critical in achieving net-carbon zero targets. Through development of Carbon Capture, Utilization and Storage projects globally, Mitsui will help create an eco-friendly society.”
Viridor
“Viridor stands ready to invest in developing world-leading carbon capture technology. This will support our company and sector to decarbonise, as we have committed to do. But first of a kind technology projects on this scale require genuine partnership between the public and private sectors. Government policy support for waste management facilities to participate in industrial carbon capture schemes will be vital for us to keep progressing our plans.”
Growing Corporate Investment Interest in Carbon Removal
Corporate interest in investing in Carbon Removal solutions is pacing that of Carbontech, with each increasing between 42% and 44% year-over-year amongst those corporates in our Index with a cleantech-focused investment arm.
In fact, overall, 78% (18) of the 23 corporate cleantech investors now have carbon removal as a core focus or secondary focus.
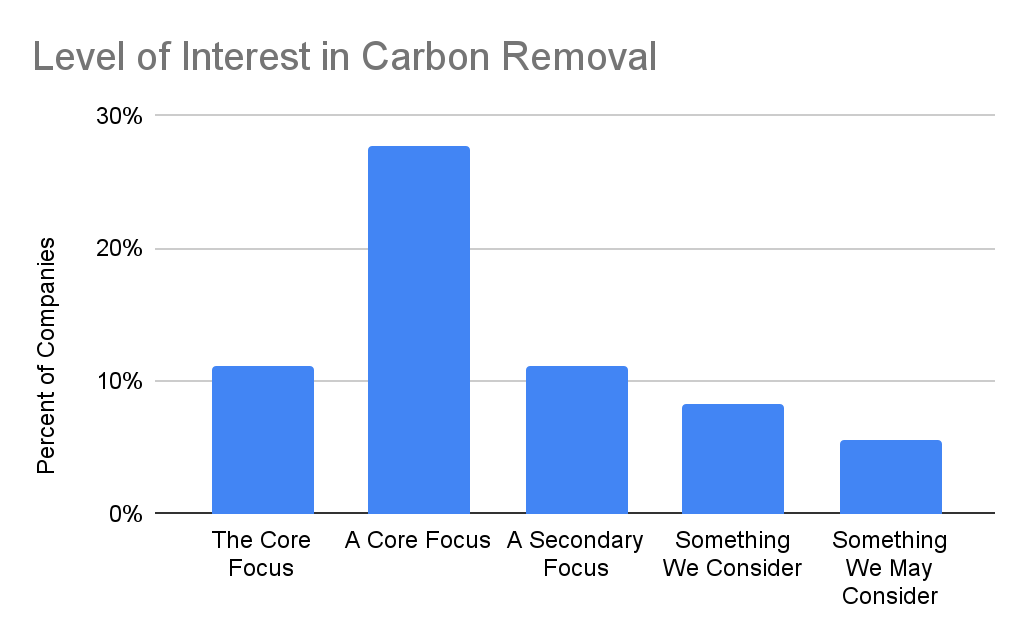
DAC-to-Sequestration Top Corporate Carbon Removal Investment Focus, Natural Carbon Removal Solutions Rising Too
This year, DAC-to-Geologic Sequestration appears to be the top focus for corporate investors interested in Carbon Removal, with 79% (15/19) of those disclosing their target Carbon Removal interest areas highlighting that pathway. DAC-to-Durable-Products is another similar highly represented focus area for corporates in the Index.
We also found a significant growth in interest in Natural Carbon Removal solutions, with Soil Carbon Sequestration and Afforestation/Reforestation each doubling this year as focus areas.
Finally, Ocean-Based Carbon Removal and Enhanced Weathering were each new to this year’s report and have gained the interest of 3 and 2 corporates in the Index respectively.
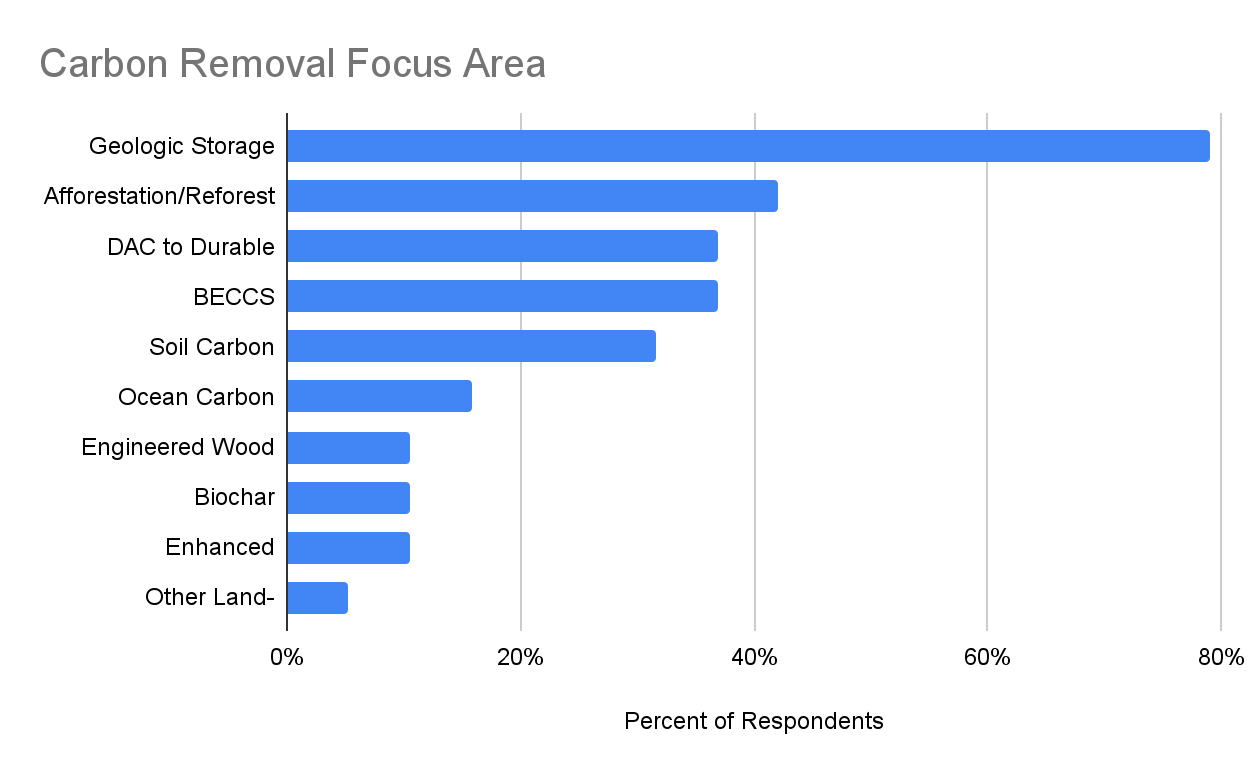
We believe the circular carbon economy is the best framework for achieving the greatest impact in reducing global emissions, while ensuring consistent economic growth.
We will begin to scale investment in carbon removals in FY22, with plans to increase those removals through 2040 and maintain net zero GHG emissions thereafter…investment in our value chain and purchasing carbon removals—will be key to ensuring that fiber from regenerative systems is available in the future.”
Notable Circular Carbon Investments
CO2-to-Building Materials
Blue Planet (Innovator)
Corporate Investors: Chevron Technology Ventures
VC Investors: For Good Ventures
CO2-to-Fuels
Lanzatech (Innovator)
Corporate Investors: BASF Venture Capital, Shell, Mitsui
VC Investors: Khosla Ventures, Next47
CO2-to-Chemicals
Twelve (Innovator)
Corporate Investors: Microsoft Climate Innovation Fund
VC Investors: Evok Innovations, Breakout Ventures, Capricorn Investment Group, Cantos
CO2-to-Polymers
Novomer (Innovator)
Corporate Investors: Saudi Aramco, DSM, Sabic
VC Investors: Flagship Pioneering, Physic Ventures
Geologic Storage
Carbfix (Innovator)
Corporate Investors: Shopify, Microsoft
Ocean Based Carbon Removal
Planetary Hydrogen (Innovator)
Corporate Investors: Corporate Investor: Shopify
VC Investors: Ramen Ventures, Capital Angel Network
Soil Carbon Sequestration
Indigo (Innovator)
Corporate Investor: FedEx
VC Investors: Empede Capital, Flagship Pioneering
Durable Wood Sequestration
Cambium Carbon (Innovator)
Corporate Investor: Exelon
VC Investor: Exponential Impact
Purchasing
Modest Increase in Corporate Circular Carbon Purchasing
We found a slight but meaningful increase in Corporate purchasing of Circular Carbon products and solutions over 2020, with 24% of all companies (19/80) making direct purchases of CO2 or Carbontech and Carbon Removal solutions. Purchases of gaseous CO2 tend to be for food & beverage or enhanced oil recovery applications, however, more companies are now also starting to buy products derived from CO2, such as “e-Fuels.” Porsche’s offtake purchase of e-Fuels produced from CO2 and water for its motor sports division is a prime example of this.
Corporate Carbon Offset purchases (reflected in the “Other” category in the chart) also seem to be increasing, While their use is gaining traction both in our Index, our direct conversations with companies, and in the press, it is often difficult to determine which specific companies are making these purchases based on publicly available data. Still, our research found that 18% of corporate Circular Carbon purchasers in our Index are purchasing offsets.
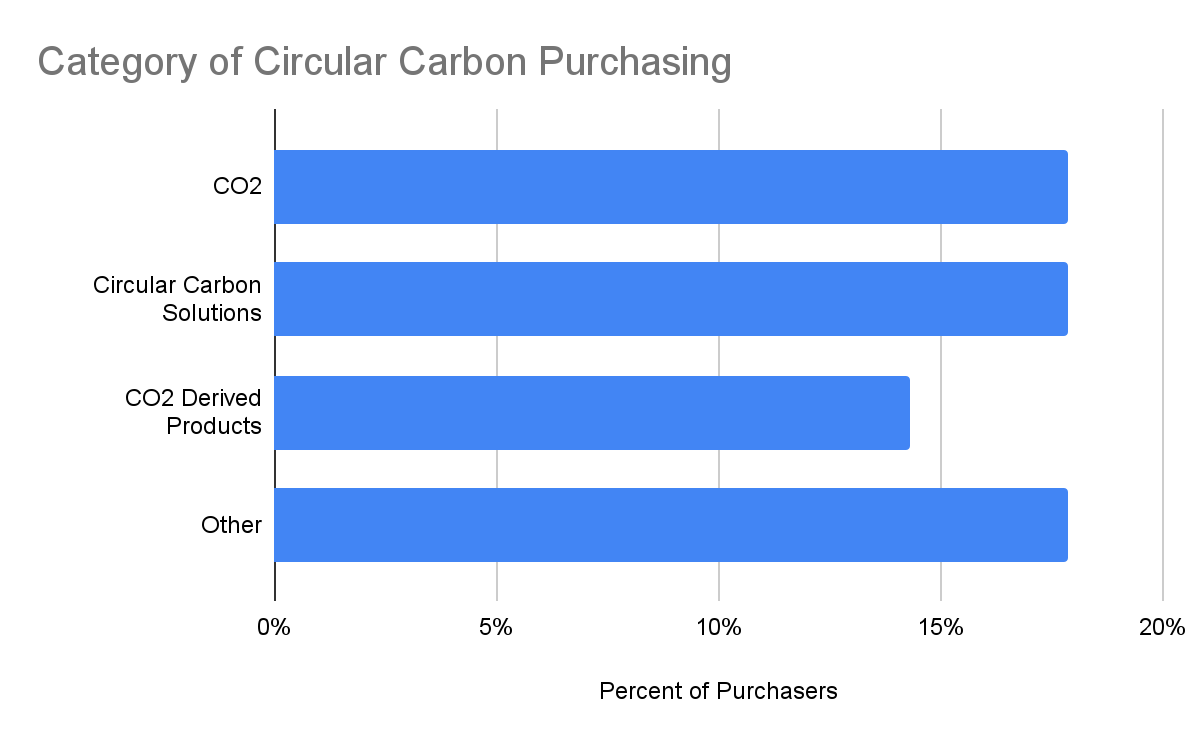
Notable Carbon Purchases
CO2
Mitsui’s Fairway Methanol, purchases and effectively utilizes captured CO2 from surrounding plants as the source for methanol production.
CO2 Derived Products
FedEx and Southwest Airlines purchase total available volume of Red Rock Biofuels renewable jet fuel.
Circular Carbon Solutions
Shopify purchases 5,000 tonnes of carbon removal from Climeworks.
Sales
Growing, More Diverse Corporate Circular Carbon Sales Activity
Our research found that over 25% (21/80) of all the Corporates in the Index are involved in some form of Circular Carbon sales, with half of those companies involved in selling Circular Carbon solutions (such as carbon capture technologies).
We also see an increasing number of corporates selling multiple Circular Carbon solutions, while 6 are both selling and purchasing.
We found a low level of activity in the sales of carbon credits, with only 3 corporates involved in credit sales, indicating that purchasing offsets is currently more common than generating them at the corporate level.
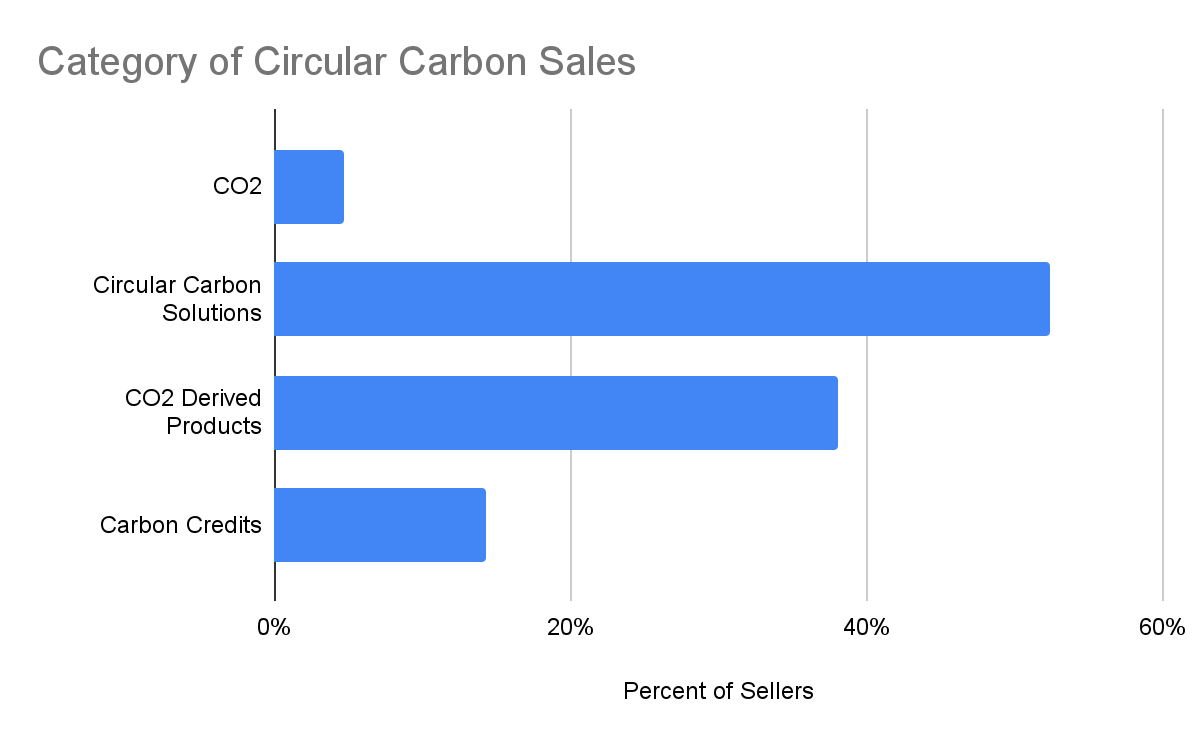
Project Hosting
Substantial Project Hosting Activity in the Energy & Industrial Sectors
Roughly a third of the corporates in the Index, or 26 companies serve as Project Hosts for Circular Carbon solutions. Despite representing only 33% of the Corporate Index, Project Hosts account for 60% (3.7/6.3 GTCO2) of Scope 1, 2, and 3 emissions and all operate in energy or heavy industry. Though perhaps not surprising, this data suggests that the greater a company’s connection to CO2 emissions, the more invested they seem to be in hosting Circular Carbon projects through which those emissions can be reduced or sequestered.
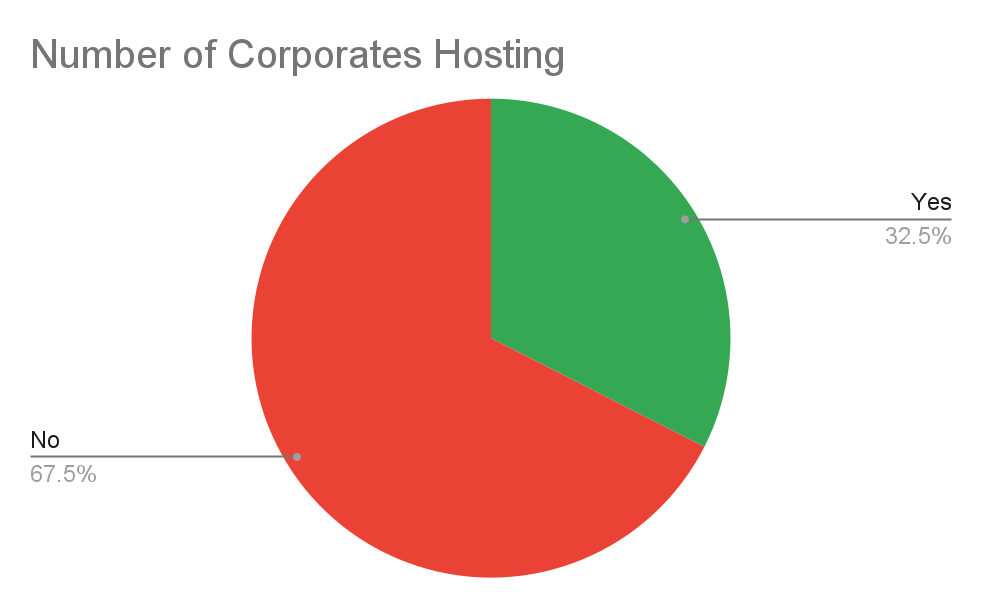
Heavy Focus on Carbon Capture Projects by Heavy Industry
Half of all the Circular Carbon-related projects hosted by companies in our Index (24/48) are focused on carbon capture, including biogas and flue gas capture. Again, this is perhaps not surprising given that all these project hosts operate in the energy and heavy industrial sectors.
Notably, however, six companies in the Index are now involved in CO2-derived fuel projects, triple the number of such projects we found last year.
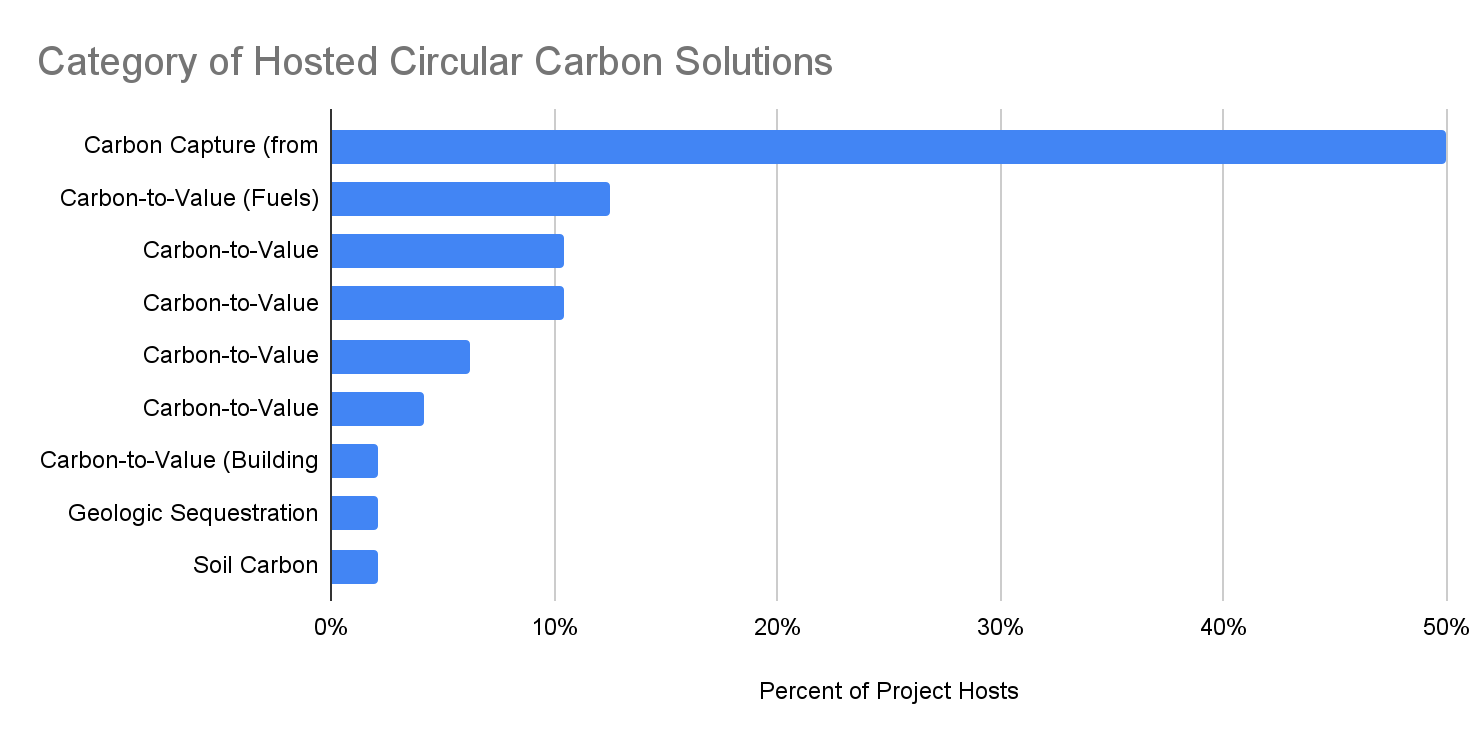
Corporate Index - Other
Continued, Diverse “Other” Corporate Intersections with the Circular Carbon Economy
During our research, we again found that nearly half of the Corporates in our Index (38 or 48%) have an additional range of activities that intersect with the Circular Carbon sector in meaningful ways, but fall outside of the main intersection points detailed above. Some representative “Other” Corporate Circular Carbon Intersections include:
Johnson Matthey, INITIATE consortium
Material suppliers; steel, urea and energy transition industrial players; multi-disciplinary research organizations; and experienced promoters of carbon capture and utilization, and circularity and industrial symbiosis topics (CO2 Value Europe)
Johnson Matthey joins Greentown Labs, Gigawatt
the largest cleantech start-up incubator in North America
C2V initiative
a member of the leadership council that is building new ecosystems like the Carbon-to-Value initiative, sponsored by NYSERDA and the Canadian Government.
Mitsui & Co.
Mitsui is a Strategic Partner of the Maersk Mc-Kinney Moller Center for Zero Carbon Shipping, the Carbon Recycling Fund Institute, and The Institute of Applied Energy, Society of Anthropogenic Carbon Cycle Technology.
Land O’Lakes + Microsoft
Land O’Lakes and Microsoft are collaborating on software that will enable farmers to estimate, develop, and sell carbon removal credits.
Algorand
The only blockchain that has announced commitments to carbon neutrality. ClimateTrade, a leader in CO2 emissions transparency and traceability, will be using Algorand as its primary infrastructure layer and leveraging its capabilities for carbon offsetting.
Siemens Haru Oni e-fuels plant
Supplier and system integrator of wind energy through electrolysis to production of fuel
CALL TO ACTION
-
Use the Corporate Index
-
Nominate organizations to add to the Corporate Index
-
Update data in the Corporate Index
-
Join our Network
-
Contact us, if there is something else we can help you with
Catalyst Landscape
About the Index
Market catalysts can take many shapes and forms — from individual “thought leaders” to non-profit advocacy organizations and industry associations to more commercial service providers, project developers, and more. These actors both help stitch together a critical supportive infrastructure and bring a level of vision, passion, and missionary zeal that a new space needs to survive and thrive.
The Catalyst Index is designed to help market participants of all types better understand and access the services, expertise, resources, and support that the growing number of enabling organizations in and around the Circular Carbon sector offer. We report here on over 100 organizations that play a significant role in supporting the growth of the sector. All the data in the Catalyst Index is derived from our research team’s review of publicly available information as well as user submitted data. We know that our Index just represents the tip of the iceberg of this growing ecosystem and welcome nominations and suggested updates to the Index.
Data Snapshot
101
Organizations
9
Countries
23
Service Types
That became our objective: to try and begin and evolve new things – technologies, policies, partnerships, projects – in the CDR world that might not happen without us.
Catalyst Index Overview
Growing Diversity in Catalyst Org Types
We are seeing a more even distribution of support organization types in the Catalyst Index than last year – a sign of the growing richness of the ecosystem. Conveners and Platforms are the most common organization type this year, versus last year’s leader NGOs. Service providers are the second highest, perhaps evidence of the growing business opportunity in servicing the Circular Carbon economy. There is also growth in Accelerators and Think Tanks.
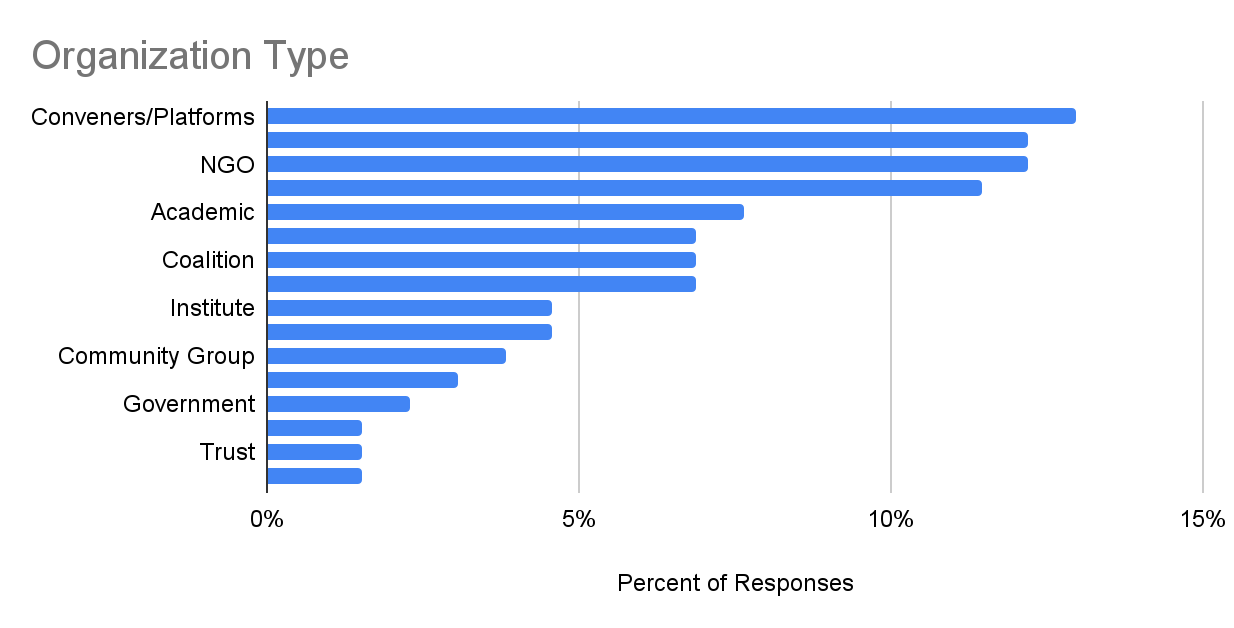
Representative Organizational Descriptions
Negative Emissions Platform
The Negative Emissions Platform is a Brussels-based partnership to improve the political and public recognition of carbon removal technologies and solutions. We represent technology developers, providers and sponsors, research centers, academia, think-tanks and the civil society. Our main focus is on engineered and hybrid approaches with a potential for permanent removal of CO2. We also actively promote the use of atmospheric CO₂ in e-fuels, materials and chemicals as a way of closing the carbon cycle, while delivering the economies of scale and cost reductions for atmospheric capture technologies.
Cleantech Open
The Cleantech Open runs the world’s largest cleantech accelerator. Our mission is to find, fund and foster entrepreneurs with big ideas that address today’s most urgent energy, environmental and economic challenges. We provide the infrastructure, expertise and strategic relationships that turn clever ideas into successful global cleantech companies. Fueled by a global network of more than 1,000 volunteers and sponsors, the Cleantech Open unites the public and private sectors in a shared vision for making the cleantech sectors a thriving economic engine around the world.
Coalition for Negative Emissions
We are a collection of organizations from a diverse range of industries with a shared ambition: to create a sustainable economy while helping protect the environment. Our goal is not just to decarbonise, but to decarbonise while ensuring continued economic progress. To do this, negative emissions will be essential. Our current members include landowners and environmental stewards, large users and generators of energy, technology start-ups and large manufacturers and operators within aviation and agriculture.
The Yale Center for Natural Carbon Capture
launched by a generous gift from the FedEx Corporation, will focus on developing collaborative and innovative solutions to remove carbon dioxide from our atmosphere and mitigate the effects of greenhouse gas emissions through ecosystem capture, geological sequestration, or other natural geochemical processes.
On Deck Climate Tech (ODCT)
On Deck Climate Tech (ODCT) is a network of top experts, leaders, advisors, and investors across the climate tech ecosystem with a focus on catalyzing global climate solutions. Founders get access once accepted to ODX, our community-backed accelerator.
CCS+
The CCS+ Initiative is a new venture to leverage carbon markets and to scale up global decarbonization and carbon removal efforts. The CCS+ Initiative will focus on advancing carbon accounting for a range of carbon capture, utilization, storage, and removal technologies that are underpinned by robust ‘cradle-to-grave’ life cycle assessments (LCA) and rigorous verification standards to ensure environmental integrity.
ClimatePartner
ClimatePartner is a leading solutions provider for corporate climate action. Together with its clients, ClimatePartner implements customized solutions for calculating and offsetting CO2 emissions to achieve climate neutrality for companies, services and products. ClimatePartner also advises companies on climate protection strategies and reduction measures. As part of this process, ClimatePartner ensures transparency through a clear labeling system that is anchored in an IT solution certified by the Austrian technical inspection authority (TÜV Austria). For offsets, ClimatePartner develops its own carbon offset projects and offers a broad portfolio of recognized carbon offset projects in cooperation with a global network of partners.
Black & Veatch IgniteX
IgniteX is a 12-week virtual program designed to partner with start-ups offering scalable solutions for critical human infrastructure. Program participants are partnered with Black & Veatch experts to co-develop, pilot, and/or market their new technology. Solutions partners receive opportunities for mentorship, access to our vast network, product testing, pitch development, investor introductions and funding up to $50,000. Through this year’s IgniteX Program, we’ve solicited proposals from bold, leading-edge thinkers and partners for technologies that promise to accelerate the development of decarbonization solutions.
Continued US and European Focus
Like our other Indexes, the Catalyst Index remains strongly weighted towards organizations headquartered in North America, with most other institutions in Europe. In Europe, we see Germany adding 3 new additions to the Index, and the UK playing an even more prominent role (14% this year vs 9% last year).
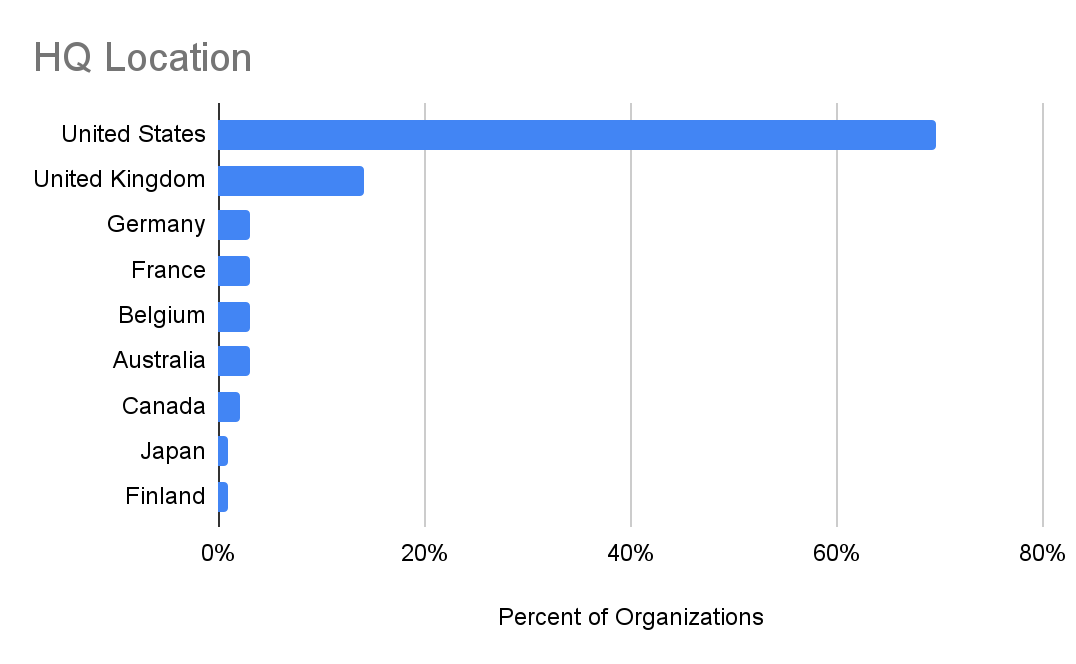
Flourishing of New, Entrepreneurial Support Organizations
Most organizations in the Catalyst index have a small number of employees — under 10 is the most common and 53% have less than 25 employees. There are also a modest number of large organizations (over 1,000 employees). Most of the new additions in the Index in 2022, however, remain in the under 100 employee range. Given the still early stage of the sector, it is perhaps not surprising that smaller, more entrepreneurial organizations are the first movers into the space.
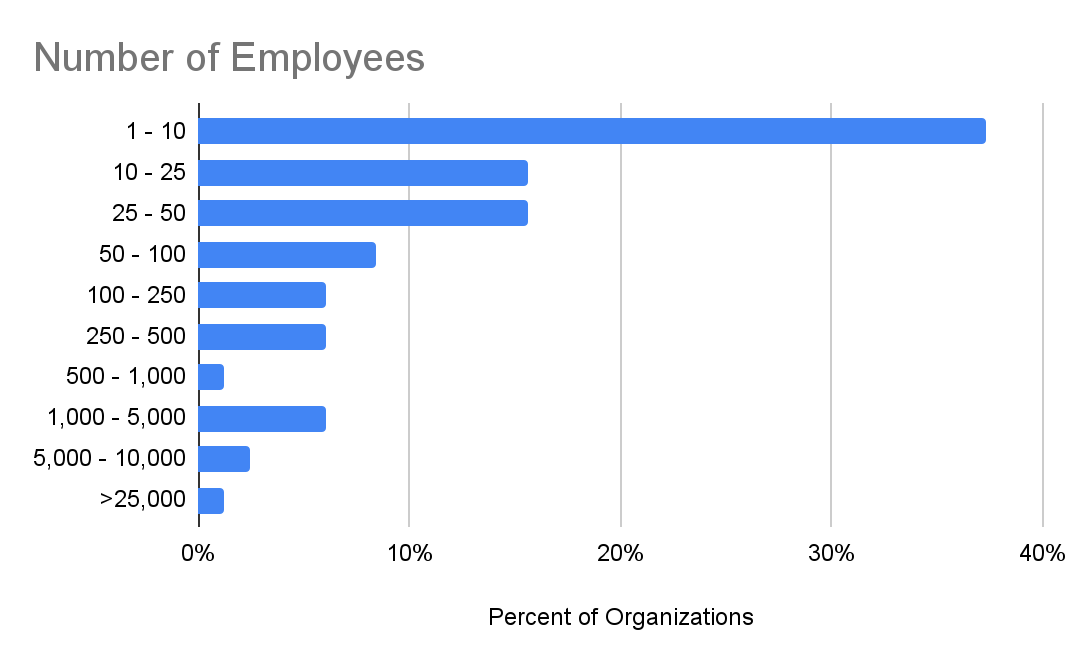
Activities and Focus Areas
Significant Increase in Policy Focus and Overall Diversity of Activities
Since our core goal for the Catalyst Index is to help participants in the Circular Carbon economy find the specific types of support they need to advance their respective work, we track the type of core services or activities that each of the organizations in the Catalyst Index undertakes. This year, there is an even broader distribution of core activities amongst organizations in the Catalyst Index, a positive indicator that the sector is evolving, specializing, and growing.
Specifically, we saw a significant increase in organizations focused on Policy (a 144% increase from last year) with 23 more policy-focused organizations added in 2021. This is both a reflection and possibly a driver of increased global policy activity around Circular Carbon and climate change more generally. Similarly, the following diverse set of core activities also doubled in representation in the Index: Research & Development, Communications, Conferences, Offsets, Design, Certification Services, and Engineering Services.
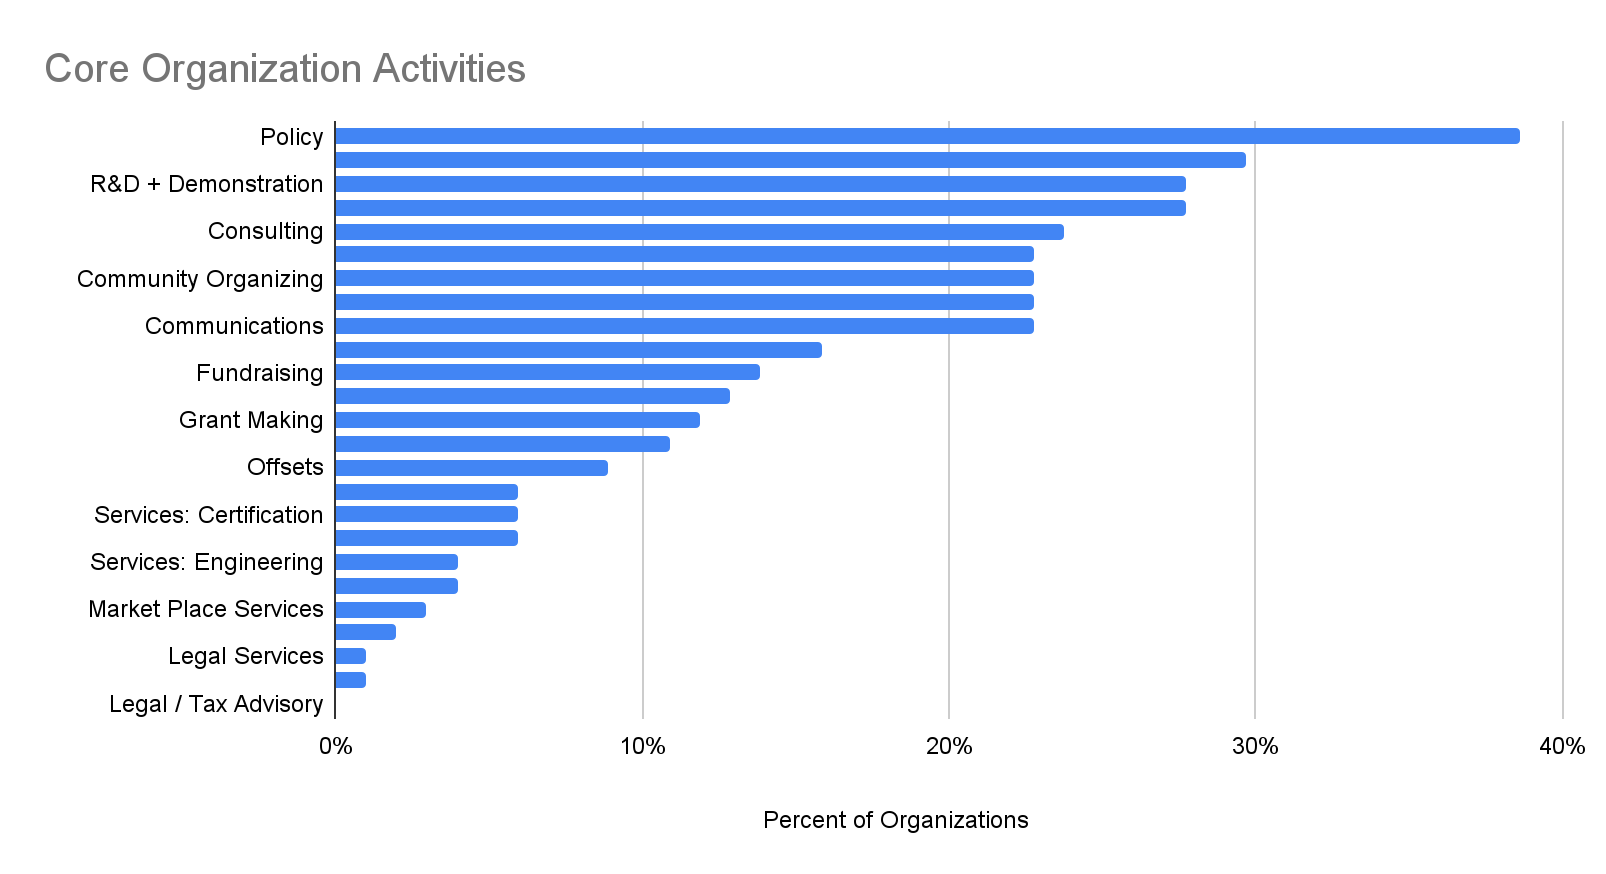
Target Customers and Stakeholders
Diverse Target Customers, Large & Small, with Government Noticeably Rising on the List
In order to understand who the organizations in the Catalyst Index seek to pair themselves with, we identified each of their core target stakeholders. The two top customer groups are on opposite ends of the size spectrum – corporates and start-ups. The other large groups are capital providers, governments, and the general public. As the numbers suggest, many seek to serve multiple of these groups. Government as a target stakeholder grew noticeably this year, which might reflect the uptick in Circular Carbon-relevant policy activity globally.
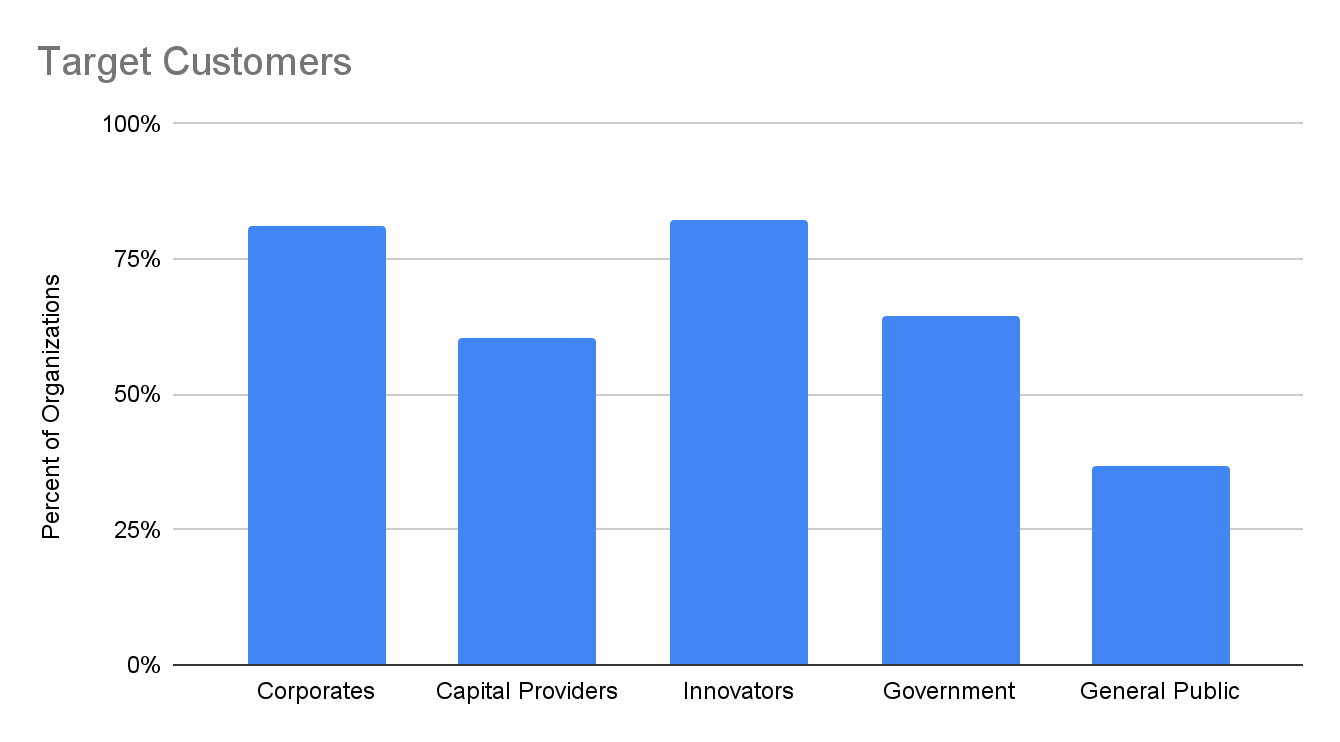
Strong Focus on Circular Carbon Across the Index
Because we specifically seek to add organizations to the Catalyst Index that already have Circular Carbon-relevant activities, it is not a surprise that 94% of the entities in this year’s Index have Circular Carbon as a Core Focus or a Secondary Focus. However, we see this as confirmation that these organizations may be worth considering as collaborators for market participants who are looking for specific types of support tracked in the Index.
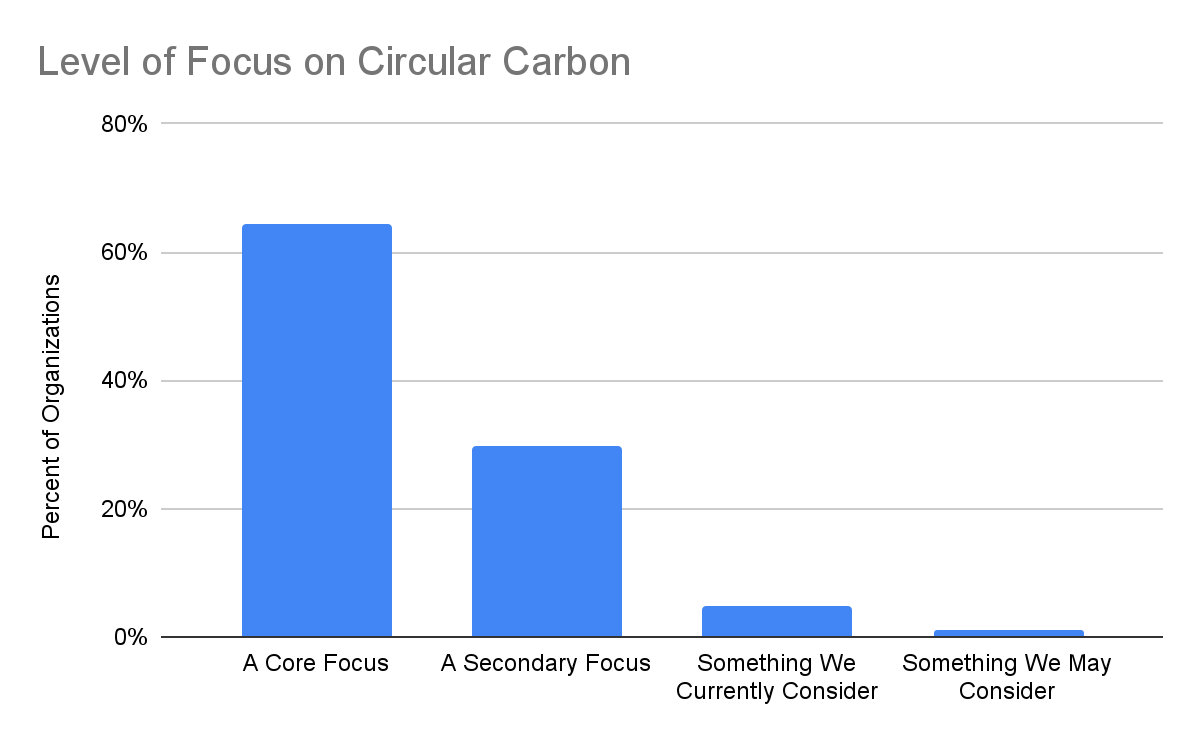
Carbontech Top, but Increasing Focus Across all Circular Carbon Pathways
Organizations in the Index are focused on a wide variety of Circular Carbon solution pathways, with carbon capture and carbon-to-value pathways clustered at the top. This may reflect both CCN’s historic focus on carbontech (and hence knowledge of and interactions with related catalyst organizations) as well as the more “established” nature of carbontech in general in comparison to the newer biological and geological Carbon Removal pathways that have started to come into focus more recently. However, this year’s additions to the Catalyst Index definitely increased and diversified the level of coverage across the broader spectrum of Circular Carbon solutions
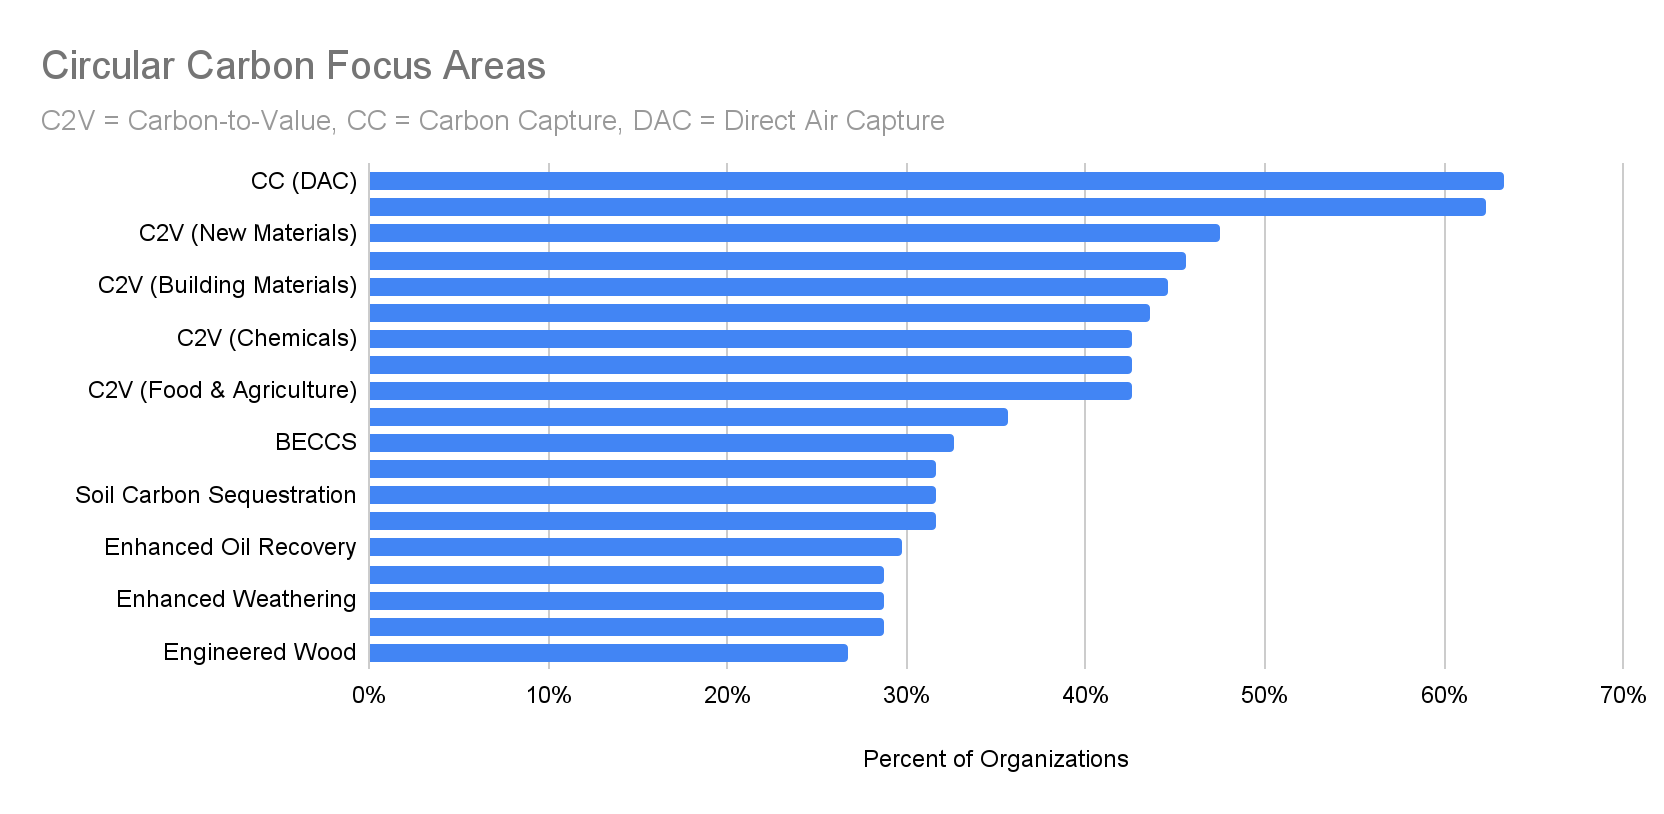
Notable Circular Carbon Initiatives
Direct Air Capture Coalition
The DAC Coalition supports the global effort to address the climate challenge by bringing together diverse, global leaders – from technology, business, finance, government, and civil society – to connect, educate, engage, and mobilize around Direct Air Capture — a critical solution for addressing climate change and unlocking a more sustainable, equitable, and prosperous future. The DAC Coalition aims to serve as the connective tissue for the emerging sector and act as a focal point for collaboration and mobilizing deployment throughout the space.
Carbon Business Council
The Carbon Business Council is an association of companies unified in reducing climate pollution. Our members are focused on natural and technology “negative emissions” to remove climate-warming pollution from the atmosphere to protect our planet, stimulate the economy, and foster climate justice.
Carbon Removal Advocacy Europe (CDR Advocacy)
Starting in the UK, our mission is to dramatically raise Europe’s ambition to become a global leader in CDR. Our ethos is to remain pathway-neutral and inclusive, ushering in large-scale research funding, deployment incentives, and public acceptance of all effective CDR techniques. Equity and environmental justice are central to climate action and will be a key part of our mission.
CALL TO ACTION
-
Use the Catalyst Index
-
Nominate organizations to add to the Catalyst Index
-
Update data in the Catalyst Index
-
Join our Network
-
Contact us, if there is something else we can help you with
ACKNOWLEDGEMENTS
We gratefully acknowledge the contributions of all those who made this report possible:
The Circular Carbon Network Team
- Nicholas Eisenberger, Circular Carbon Network – Author
- Ongeleigh Underwood, Circular Carbon Network – Author
- Kevin Biehl, Circular Carbon Network – Research
- Ligia Deschamps, Circular Carbon Network – Research
- Daniel McKenna, Circular Carbon Network – Data Design & Research
- Marcius Extavour. XPRIZE – Editor
- Nikki Batchelor, XPRIZE – Editor
Our Data Partners
- Carbon180
- Global CO2 Initiative
- CO2 Value Europe
- AirMiners
- The CREO Syndicate
- Carbon-to-Value Initiative
Index Design Reviewers
Many market participants have provided us invaluable feedback on the design of the Data Indexes that form the basis of this report. Stand out contributors include: Maurice Benning (Shell Ventures), Temple Fennel (Clean Energy Ventures), Julio Friedmann (Columbia Center On Global Energy Policy), Richard Jackson (Oxy Ventures), Richard Kauffman (Generate Capital), Gabriel Kra (Prelude Ventures), Dan Matross (CREO Syndicate), Dan Miller (Roda Group), Adam Rein (Mission Point Capital), and Johanna Wolfson and Matthew Nordan (PRIME Impact Fund). We heartily apologize to those we missed.
Our Sponsors
This report was funded through the generous support of our sponsors:
![]()