Contribute Data
Please select a category where you want to contribute.
The Circular Carbon Market report is an analysis of the data collected in the Indexes over the past year, revealing investment, technical, and commercial dimensions and trends in the sector. We divvy up the analysis into three sections — Sector Dynamics, Innovators Guide to Investment Trends, and Investor Guide to CCN Index Capital Trends — and answer critical questions within this framework.
The overall intent behind the report is to share our data in a way that gives more context, character, and depth to this emergent ecosystem, increasing overall interest and understanding in the sector, and facilitates informed action between innovators and capital providers.
Here is a sample of our findings:
This section covers a broad overview of questions about the sector, including TRL levels, sector segmentation, how many innovators are making products, what industries they are targeting, catalyst organizations and more.
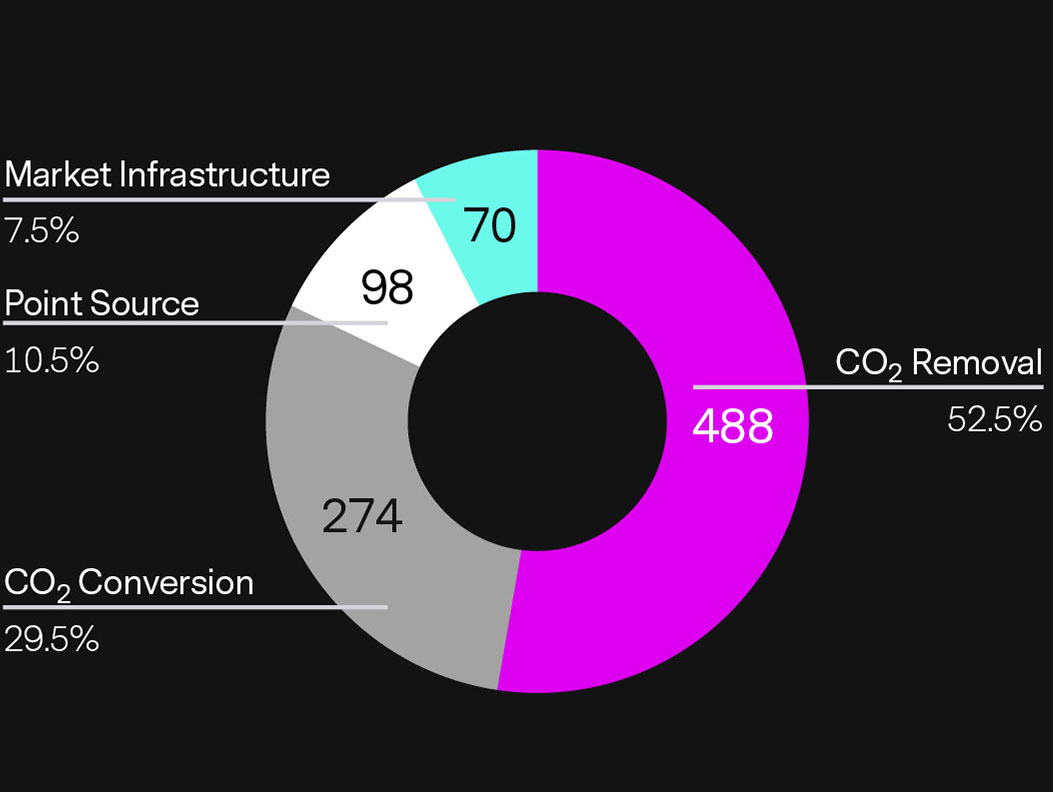
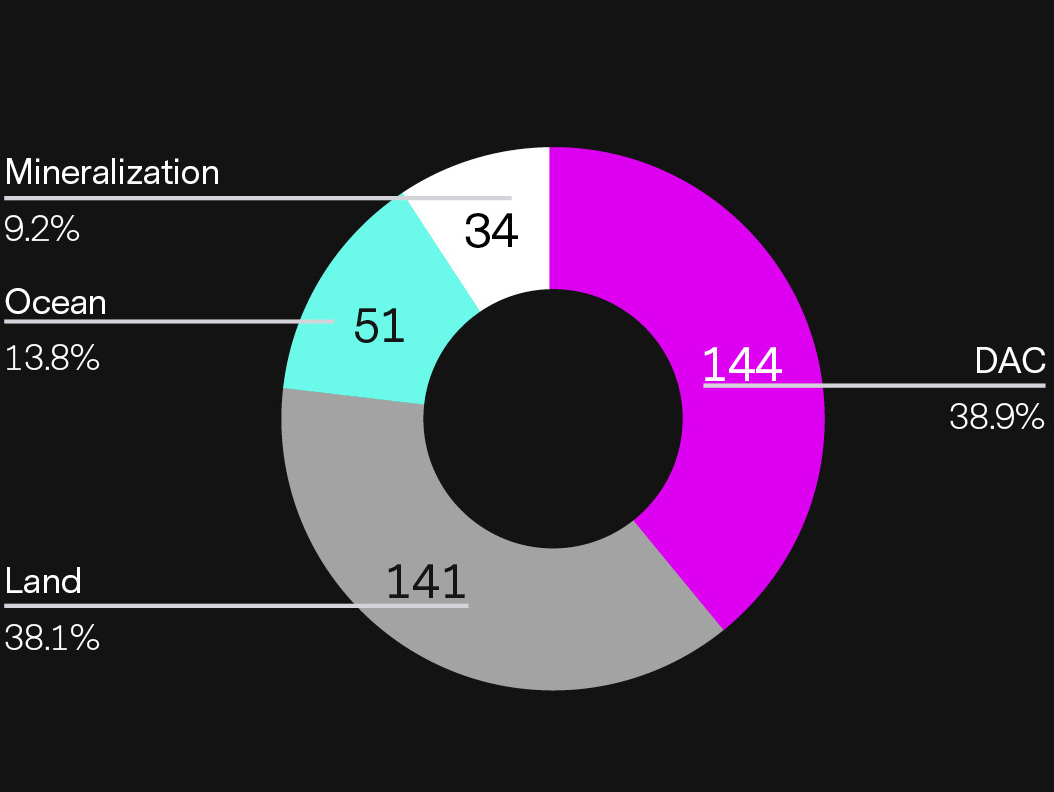
While we continue to show a wide range of solution types, over half of innovators in the Circular Carbon Index are pursuing CO2 Removal. Within that, we see Direct Air Capture (DAC) and Land Ecosystems as the most dominant. Additionally, we observed 179 innovators that selected two or more solution types. CO2 Removal + Conversion (132) is the most common Circular Carbon category combination.
$5.77B
$2.69B
$20MM
The cumulative amount of capital raised to date by all companies listed on the Innovator Index is $5.77B. This capital spans philanthropic to venture to founder funding. In terms of trends, we were able to track a significant increase in total capital raised to date since the last report, totaling an increase of $2.69B. It is important to note that these numbers are self-reported and are not easily verified. However, because of the sensitivity and visibility of the CCN indexes, we expect high reliability from companies whose intentions are to go through the rigorous process of raising capital.
Read the Full ReportThis section is meant to inform innovator's fundraising strategy by offering benchmarks and trends. The analysis considers deal dynamics, segmented by funding and solution category, which can be useful in understanding the funding landscape for specific innovation types.
Capital sources continue to broaden in Circular Carbon, indicated by a more diverse mix of funding types. Specifically, Founder funding rose to the top (from No. 3 last year), and along with Grants, showed the greatest YoY growth. Overall, Founder capital represents 19% of all reported capital sources.
These are strong signs that companies are both gaining more confidence in the market for their solutions by pushing ahead with alternative capital and facing increasing competition for institutional capital.
In this section we cover deal dimensions per solution type, type of capital taken on and type of capital sought, as well as the competitive landscape within each solution type.
Read the Full Report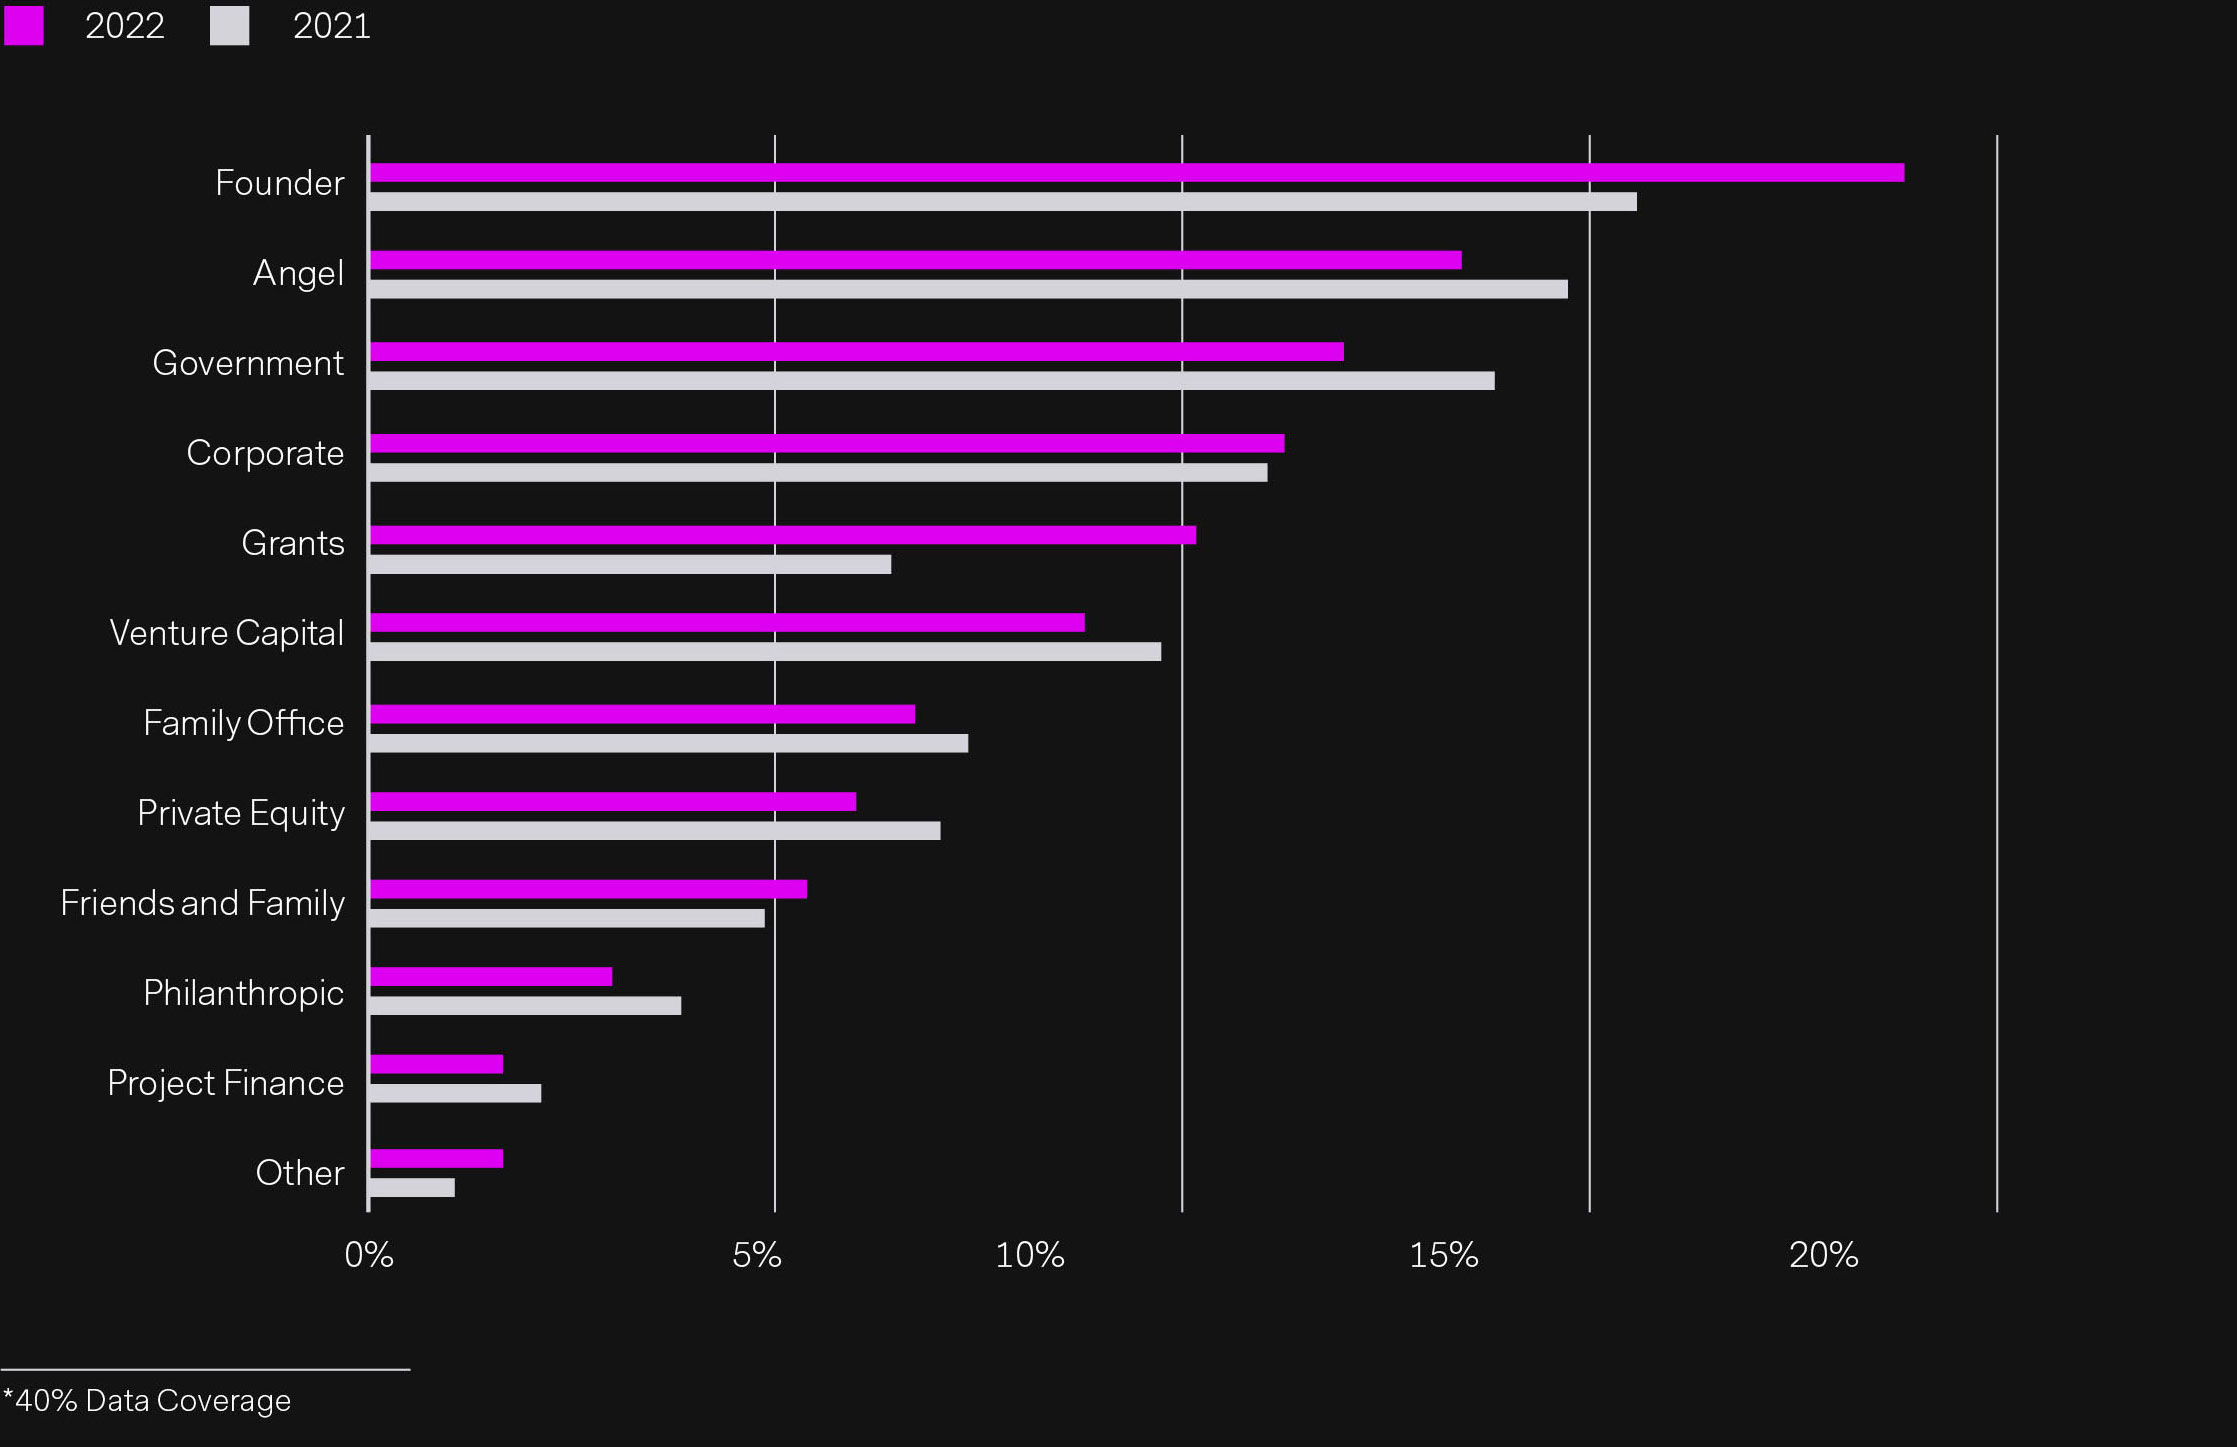
This analysis is meant to showcase some of the trends we see over time within the Circular Carbon sector as it specifically relates to capital and commercialization dimensions. In this section we cover revenue ranges, commercial stages, valuation trends, and other commercial needs of innovators.
$971mm - $2.46B
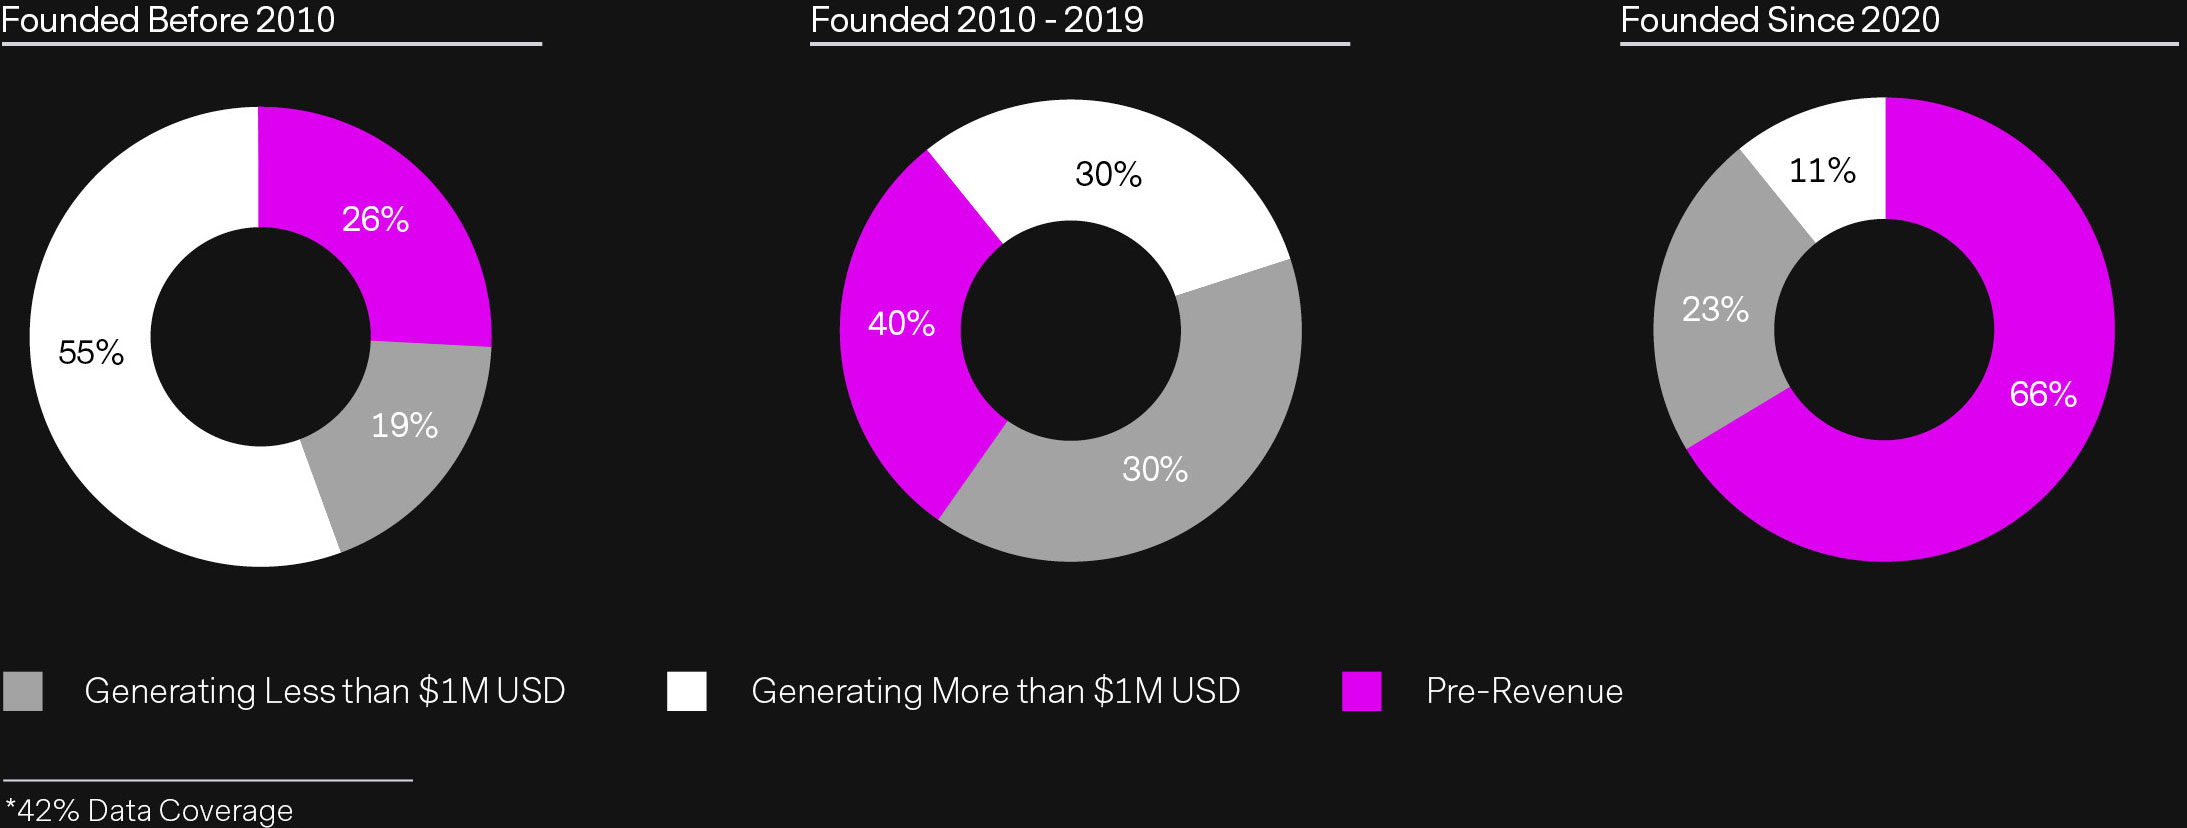
When you break down the revenue range by founding year, there is a somewhat expected trendline of more revenue generation from older companies and less revenue generation from younger companies. However, it is interesting to note that over 30% of companies founded since 2020 are generating revenue, and 25% of companies (or initiatives of larger companies) founded prior to 2010 are still pre-revenue.
When this data is averaged over the entire index, over half of Circular Carbon companies are already generating revenue. Of those, half (30% overall) are generating over $1MM. At the same time, 44% are pre-revenue. Remembering that our data is self-reported, this is a significant trend in considering the maturity and financial viability of this emerging sector.
Please select a category where you want to contribute.
INNOVATOR INDEX & DEAL HUB
CAPITAL INDEX
CATALYST INDEX
1/2
__